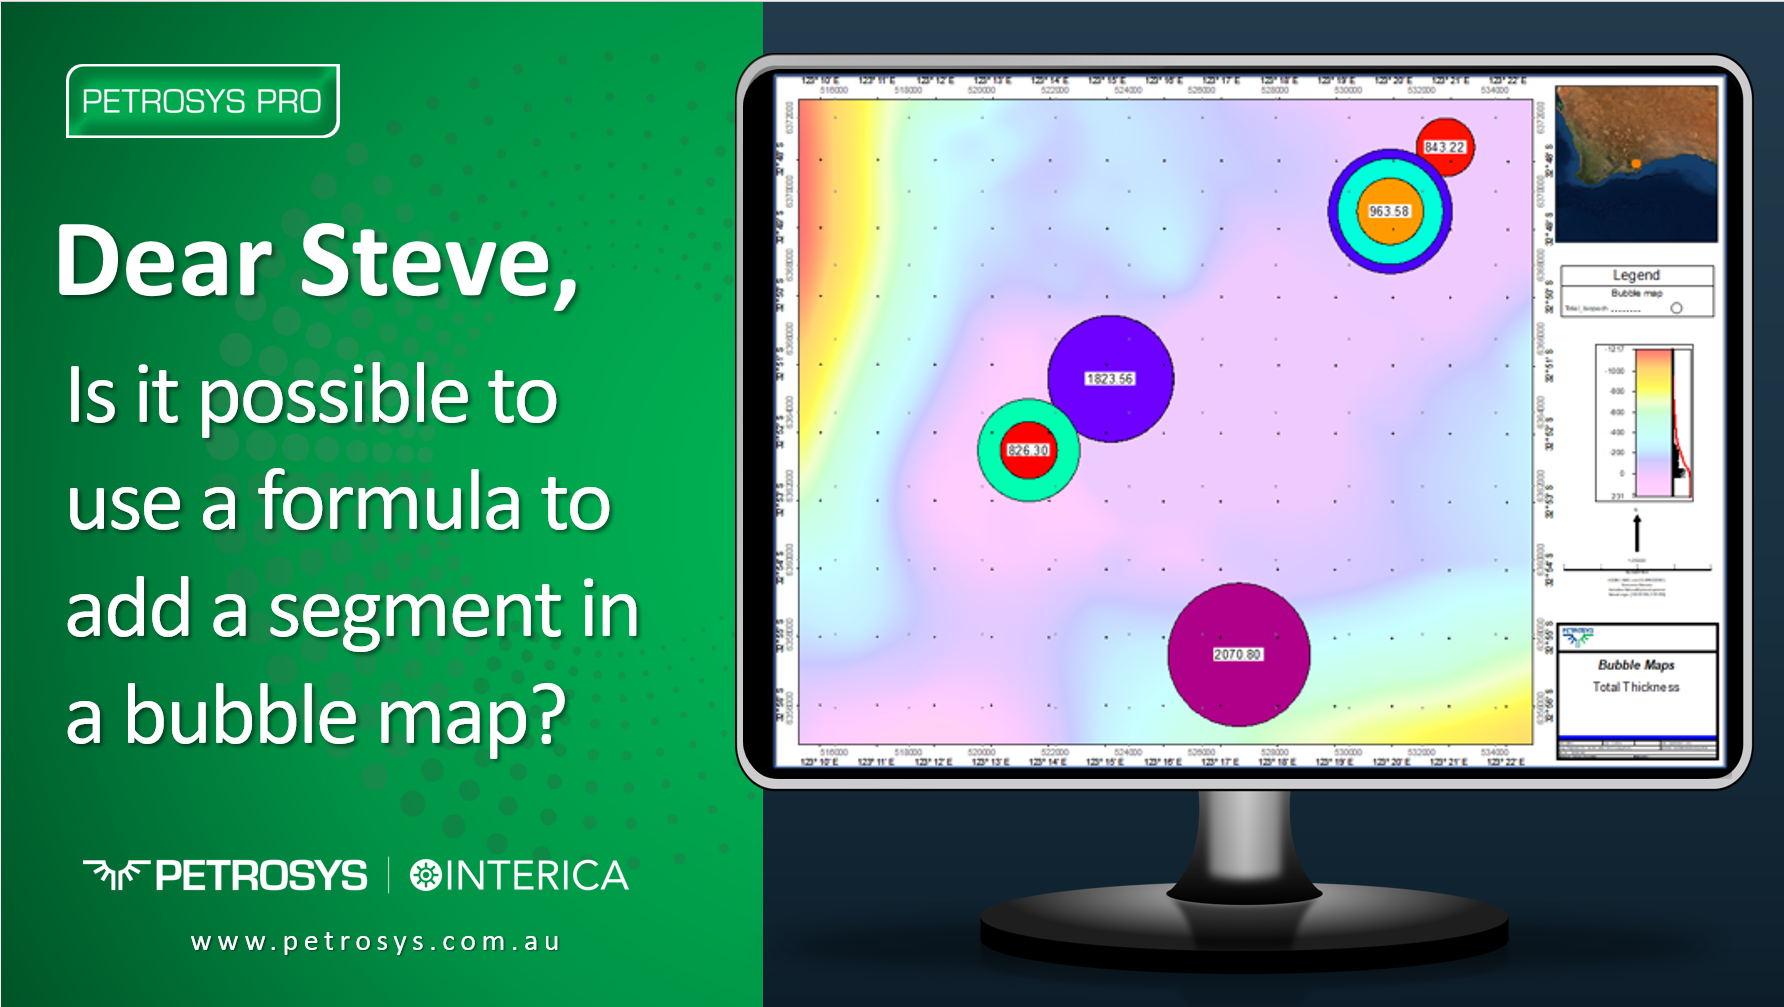
Enhancing bubble maps with calculated values using formulas
Q. Is it possible to use a formula to add a segment in a bubble map? A. Yes, it is possible!
Q. Is it possible to use a formula to add a segment in a bubble map? A. Yes, it is possible!
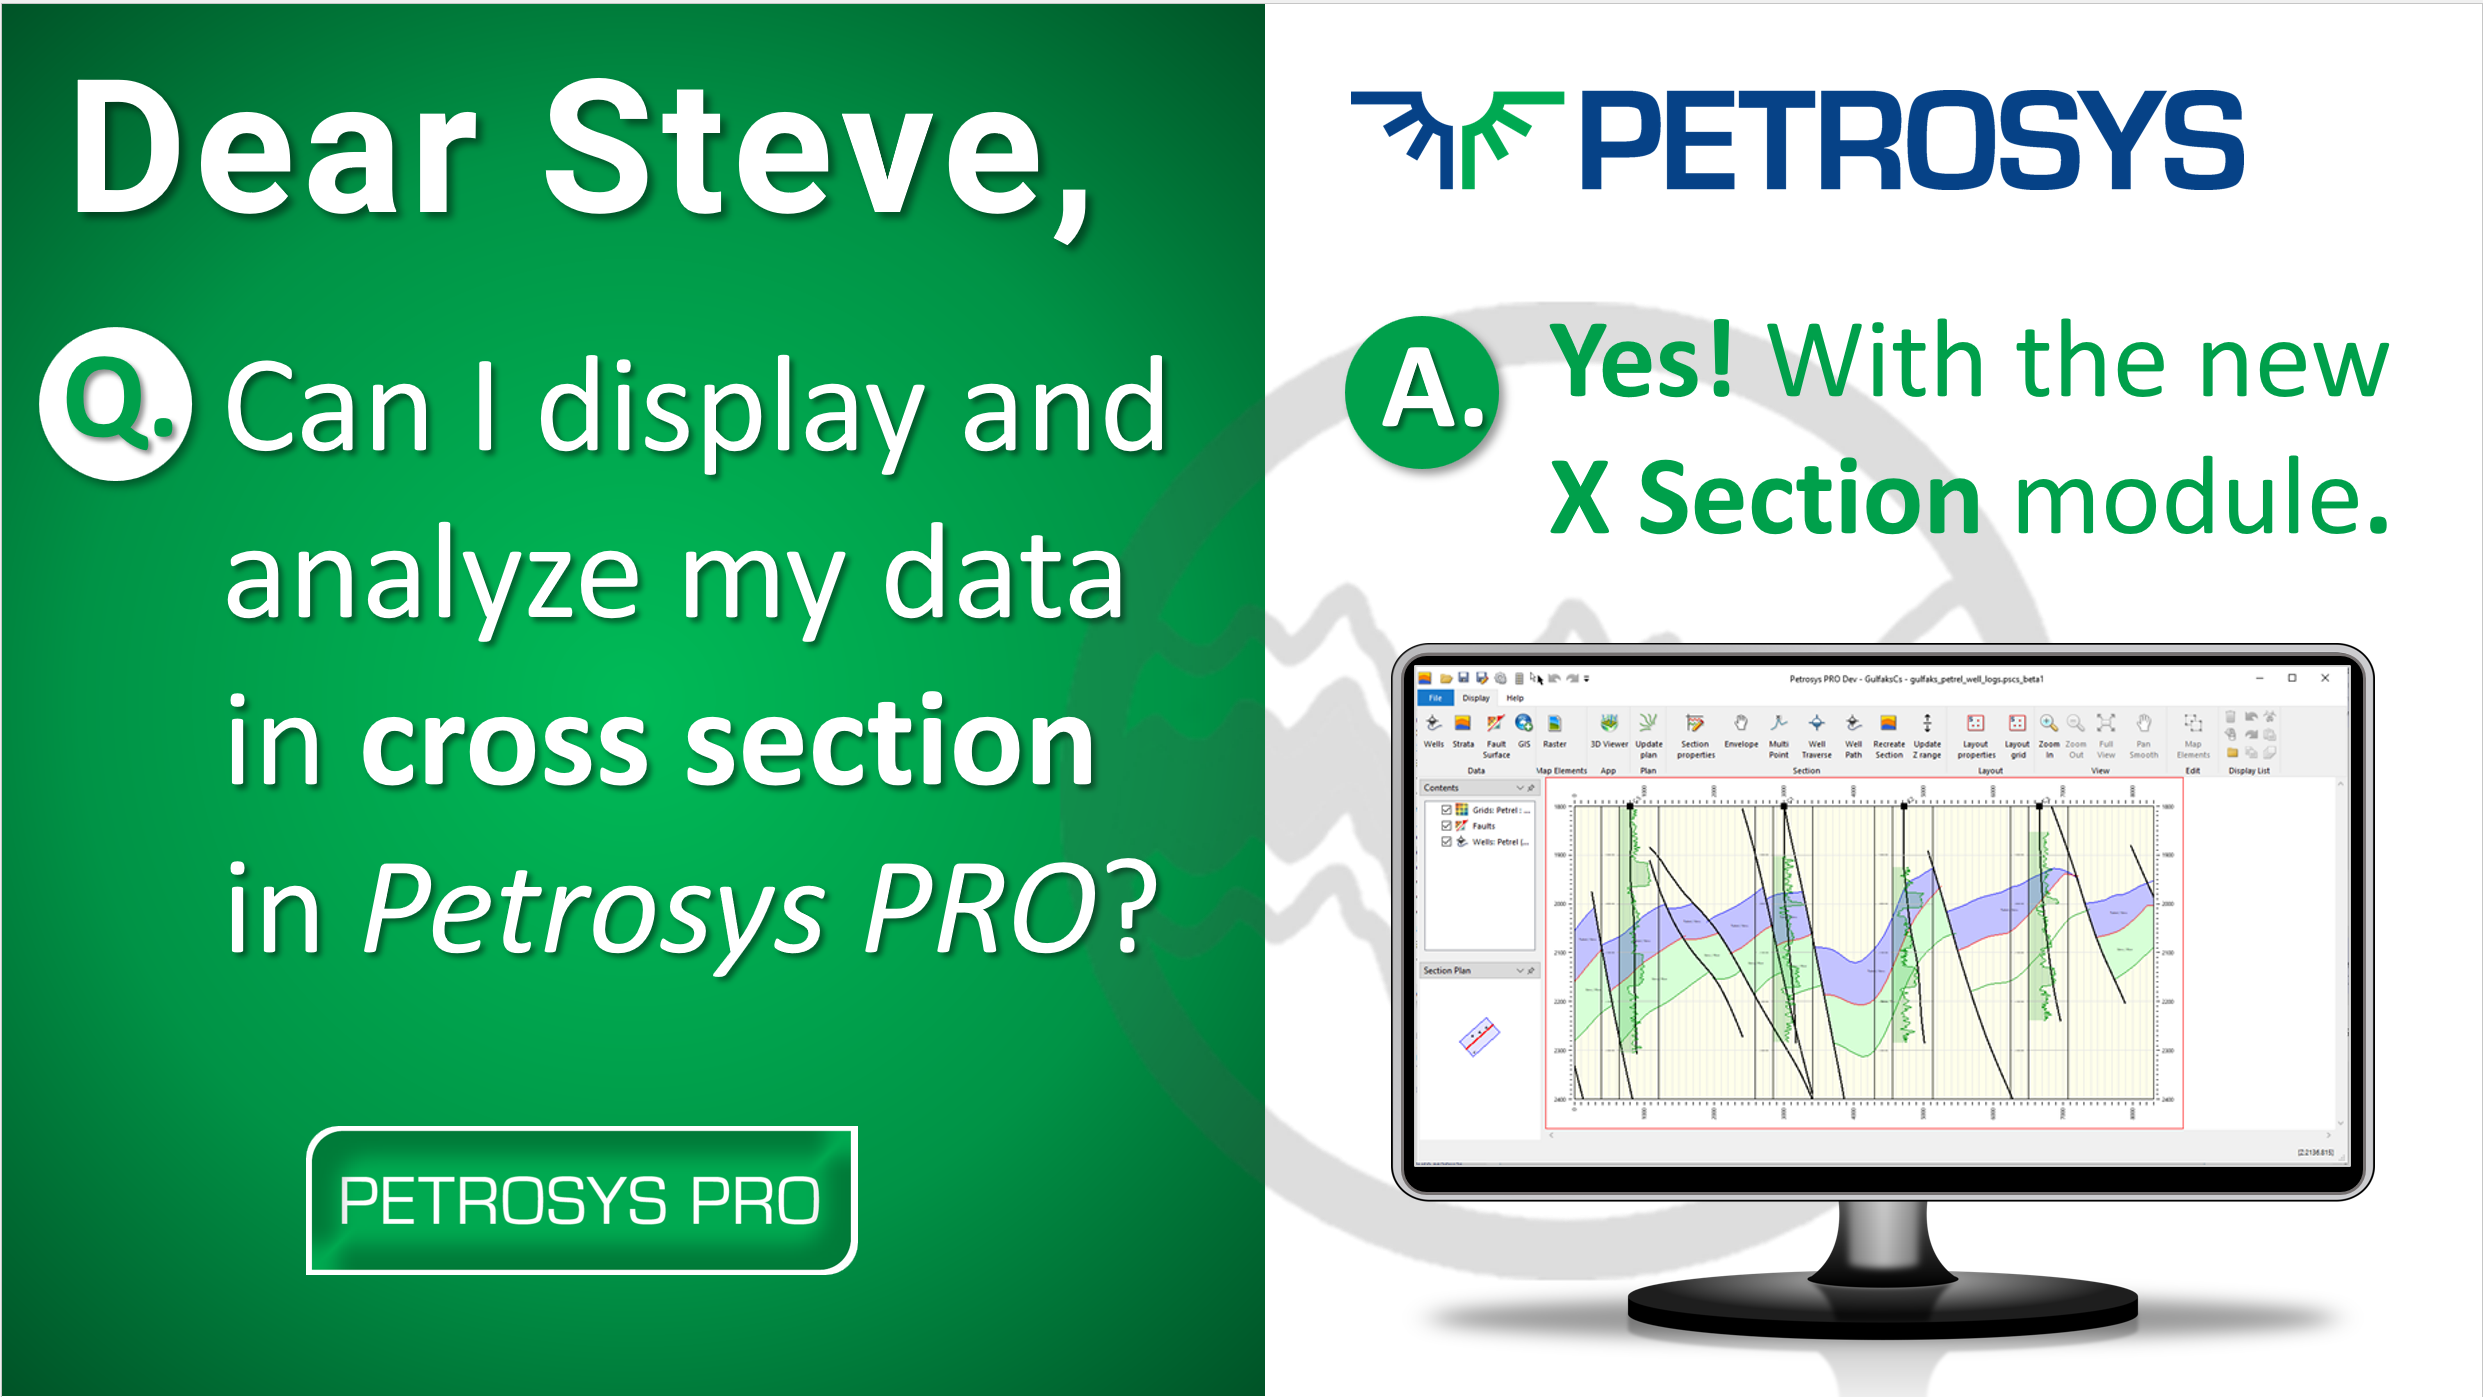
With the release of Petrosys PRO 2023.1, users can take advantage of the new X Section module. Simply click on the X Section button from the Mapping window. This will generate a cross section for the currently displayed map area and associated data.
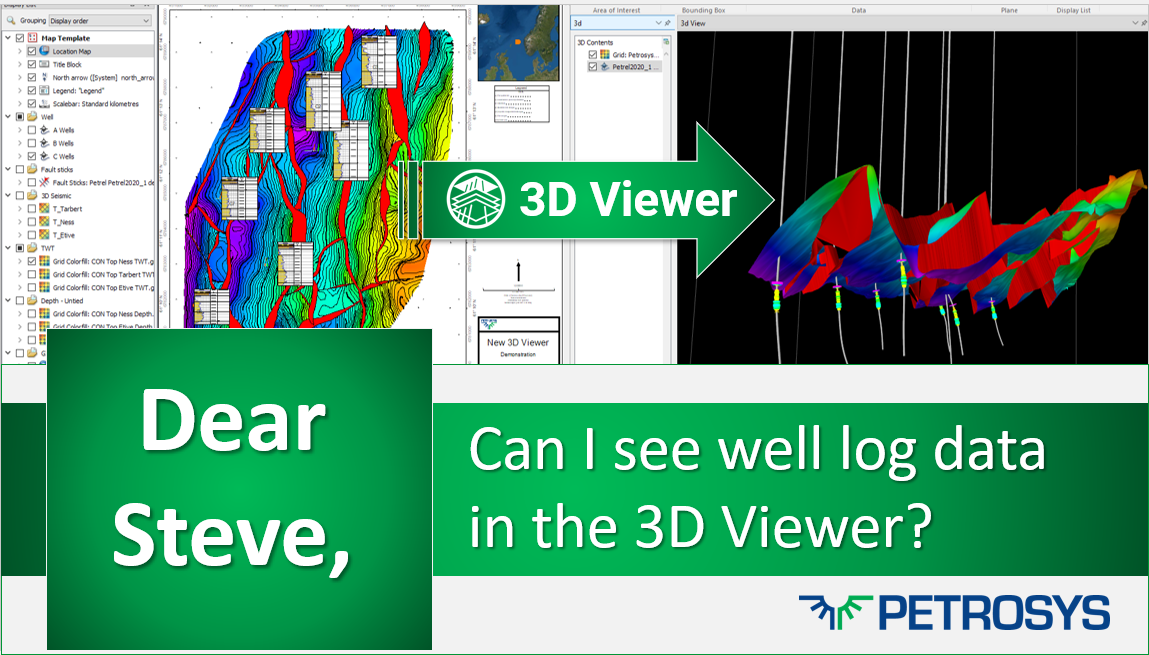
With the release of the new 3D Viewer in Petrosys PRO 2021.2, you can now visualise log data along the well path.
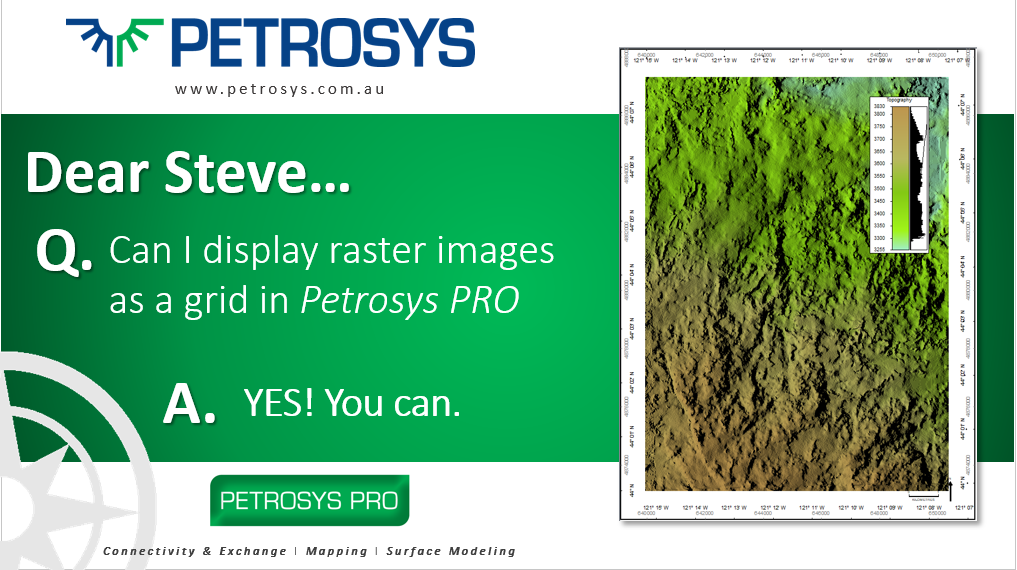
With the release of Petrosys PRO 2020.1, users are now able to display raster imagery with XYZ data as grids in Mapping and, in general, use across the software as part of any workflow.
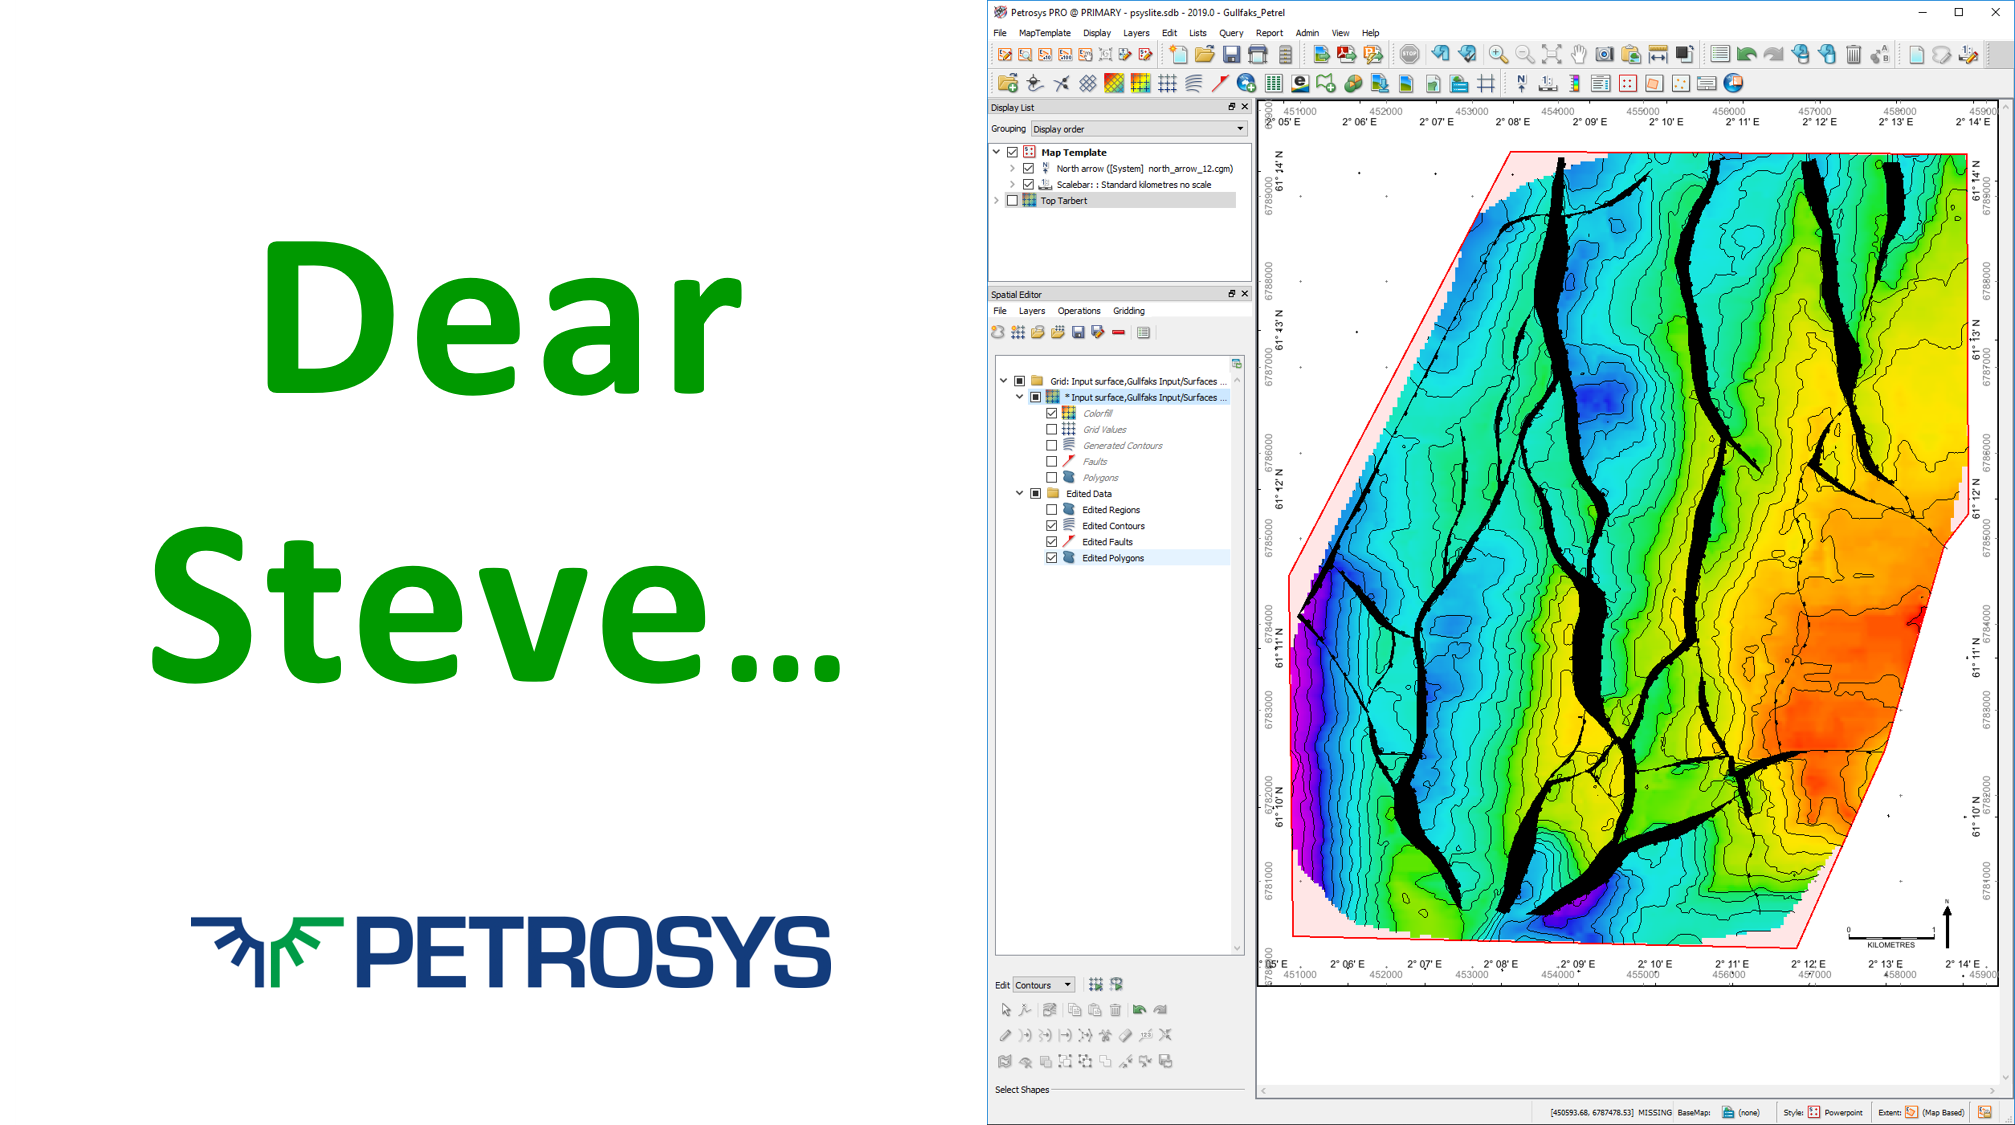
Can I edit my Petrel and OpenWorks grids directly in Petrosys PRO? YES! Since the release of Petrosys PRO 2018.2, users are able to edit grids from Petrel and OpenWorks directly in the Spatial Editor.

Finding out your map size and printing to the size you want is now very easy with the new 'page set-up and scaling' options in Map Templates.
Dear Steve, I have some polyline Petrosys faults, but I would like to get the X,Y, heave and throw values from these faults and out into an ASCII file. Can I do this using Petrosys?