Q. Can I display and analyze my data in cross section in Petrosys PRO?
A. Yes, with the new X Section module you can!
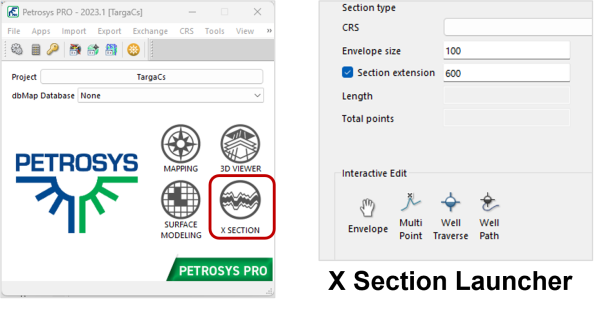
With the release of Petrosys PRO 2023.1, users can take advantage of the new X Section module. Simply click on the X Section button from the Mapping window. This will generate a cross section for the currently displayed map area and associated data.
In Mapping, go to File> Cross Section…or click the relevant icon. ![]()
- Select Section type of Envelope, Multi-Point, Well Traverse, or Well Path
- Edit the envelope dimensions if needed (can be dynamically updated later)
- Launch X Section to open the X Section Window.
Displaying all your data in the cross section
In the X Section window check and display all the relevant data you want. The surface data and well data that is displayed on your map should now be displayed in the cross section. There may also be additional data you want to add or edit at this stage.
- Click the Strata
 button in the data tree to open the display properties for surfaces and Zones.
- Add, remove, and edit surfaces and zones displayed
- Generate Fault surfaces if embedded faults are available
- Color fill between surfaces and faults
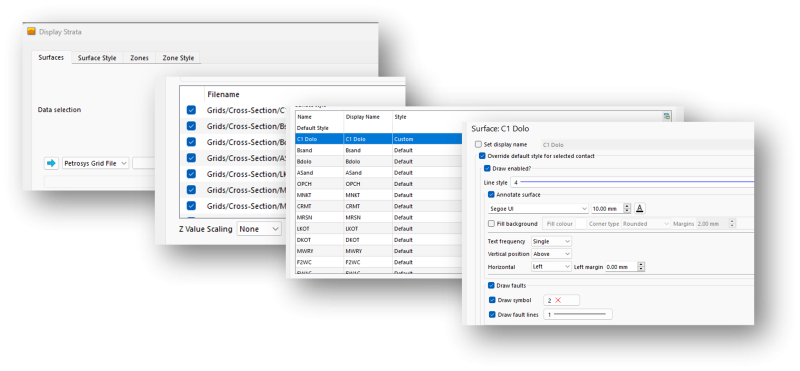
- Click the Wells data object
- Display Wells including detailed well paths, tops, and zones.
- Add any relevant fault data from fault sticks or surfaces
Examine and Investigate your data in the cross section
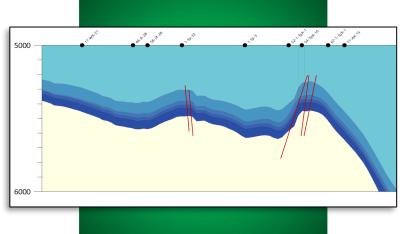
With the data now loaded the next step is to examine it. The X Section window can be used for investigating surfaces for cross over, ensuring congruency of surfaces with well picks, and viewing structural and stratigraphic geometries as they relate to reservoirs and well paths.
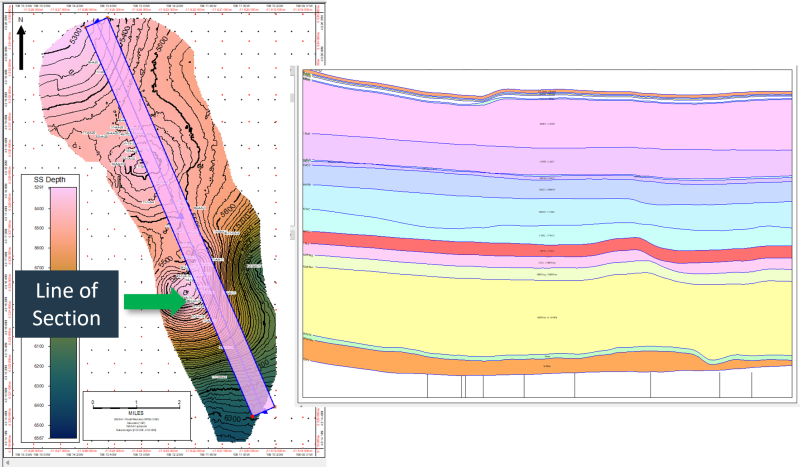
Users will be able to quickly scroll through the data by manipulating the section envelope. The envelope is interactive in the Section Plan and in the Mapping window.
Select the Envelope Icon:
- Click and drag to translate the line of section
- Hold Ctrl + scroll the mouse wheel to rotate
- Click and drag the corners to dynamically change the envelope dimensions
Now use the envelope to scroll through the area of interest to get profile views of the entire section.
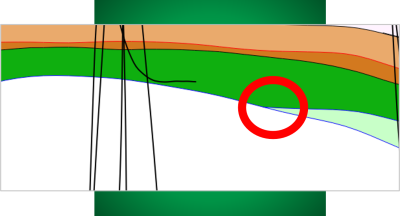
Note areas where zones have not been filled correctly to indicate where surfaces either:
- Cross-over errors
- Gaps in the surfaces near faults
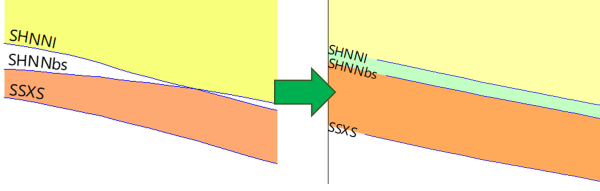
In this example, there is an error on an imported grid causing a cross over to occur near the boundary. However now by using the cross section we have generated issues that are much cleared to identify (interpretation vs gridding artifacts).
In this case, the grid can be edited in the Spatial editor such that it is conformable and consistent with the interpretation data, see the image on the right. Additionally, the user can make changes to the display to clean up and avoid any overposting of annotations.
With the data conditioning complete you can now generate the Multi-Point or Well Traverse line of section along strike, dip, or other relevant features to assess:
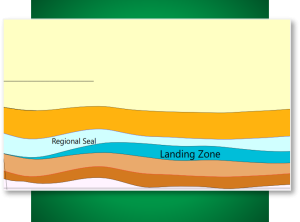
- Geometry and thickness of key reservoir beds
- Analyze the lateral and vertical variation at the regional and local scale
- Fault block delineation
- Identify Trap geometries and compare to Current well geometries.
- Evaluate the relationship between fluid contacts and compartments in the structure
- Locations of highs/troughs