Q. Is there a quick way to validate my well data when using the Well Time Depth Trend Conversion?
A. Yes! In Petrosys PRO 2017 a new option allows the user to validate their data by creating a cross validation report on the fly.
Cross validation is a powerful data QC technique that has been available for a long time when creating grids in Surface Modeling. It involves automatically re-running the task with each data point removed in turn. The generated report will show you which points are having an unusual effect on the output grid, which could help in identification of potential issues with the data.
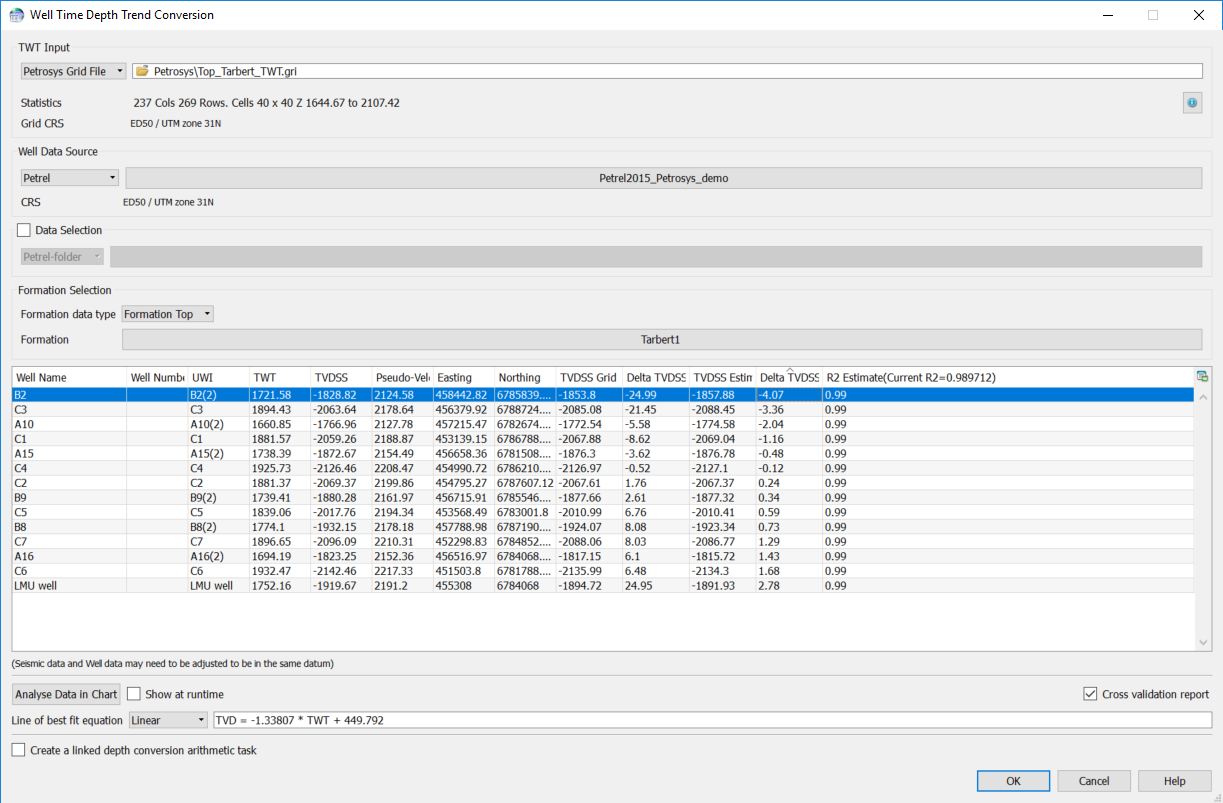
By toggling on the option “Cross validation report”, any well tops or TWT grid areas that have a potential issue would be identified easily.
In the below example, the cross-validation report has been enabled. From that report, you can see the well ‘B2’ has a delta of ~4 metres.
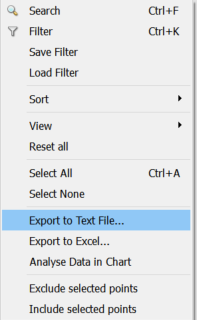
If you would like to evaluate the impact of removing this well, you can do so by right-clicking the well and select “Exclude Selected Point”. Then you will notice how the correlation factor and the best-fit equation are automatically updated.
 It is also worth checking the location of the well. To do that, open a Mapping window and display the same well data. Now when a well is selected in the depth conversion spreadsheet, it will automatically flash red in the map window. This is another feature introduced in Petrosys PRO 2017.
Finally, if the users would like to save the cross-validation report, this can be done by right-clicking anywhere on the list and select “Export to Text File…” or “Export to Excel…”


