

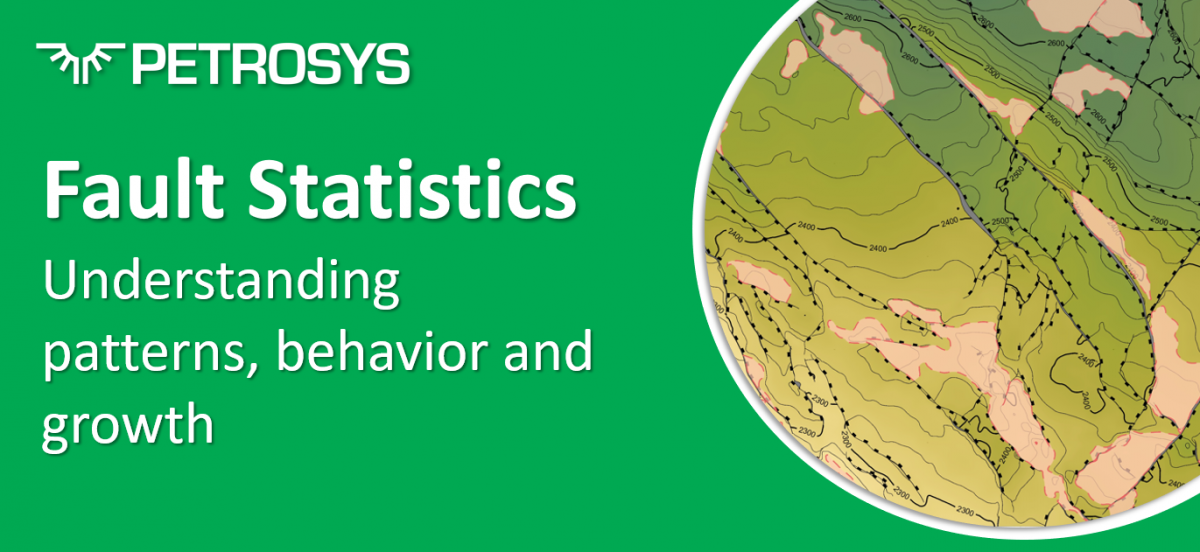
Faults play a large role in how we perceive the distribution of sediments and migration of fluids throughout the subsurface. As such, understanding fault statistics, patterns, behaviour and growth is critical throughout the O&G sector and has vital implications for CCS development.
In Petrosys PRO we love having the graphical editing tools to improve the subsurface structure of TWT and depth grids, in particular when the gridding algorithm (a mathematical operation) has failed to honour our geological understanding of the fault network. Adjusting the geometry and linkage of fault polygons, then carrying out a localised re-grid to update the structural grid, is quick and easy to do in Petrosys PRO.
Improving subsurface maps
These edits have implications for reservoir juxtaposition and spill point assessments, and thus are an important first step before carrying out any fault seal analysis work. The validation of a faulted environment can be improved with the inclusion of a number of simple plots that display fault profiles, maximum throw versus length cross-plots, rose plots and histograms.
When faults misbehave
Fault profiles show the distribution of throw across the length of a fault. When faults deviate from the classic elliptical shape the geoscientist needs to call into question the reasoning for this and determine what this tells us about the growth of the fault. Fault profiles can also identify fault segments i.e. when the throw appears to diminish in the middle of the structure. It provides useful justification for pulling apart overly extrapolated faults into their component segments, which can lead to the identification of spill points.
Integrating the plot with the map canvas through dynamic selection/co-cursor tracking, and colour mapping the fault polygons for throw, will allow us to quickly QC each fault and identify any outliers. Colour maps can also highlight the distribution of strain across a system and give a quick-pass indication of the structural history.
A maximum throw/length cross-plot is another way of QC-ing a structural map. Displacement patterns should be consistent with the fault system and long-established throw/length ratios. For soft sedimentary rocks, this ratio is between 1:20 and 1:50 (Walker and Anderson, 2016). If a formation shows faults deviating from this model the geoscientist needs to question the validity of the fault/horizon interpretation, the fault linkage and the applicability of the model.
Customer feedback to drive product development
I‘ve been working with our development team in Adelaide to scope some potential fault statistics enhancements for an upcoming release of Petrosys PRO. We’ve been given approval to put these plans into action but now need to prioritise what our Petrosys PRO user community would benefit most from first.
- Would you like to see more plotting capabilities in Petrosys PRO – particularly in relation to faults?
- Would you like to see a Fault Statistics tool that combines fault profiles with our Spatial Editor tools?
- Or would you be satisfied to simply thematically map fault throw alongside a structural grid?
- Or all the above?
Please get in touch to let me know so I can incorporate your feedback to drive our development plans for 2022 onwards.
Contact: susanna.willan@petrosys.com.au