

Subsurface Mapping – What are the differences between exploration and production maps?
What are the key differences in the data?
When I was taught subsurface mapping techniques at university, the focus was all on interpretation. We did challenges and ran through various examples to show that there is never one correct answer when mapping the subsurface. The geoscientist must use all their knowledge and skill to build up a conceptual model of the structure or stratigraphy of the subsurface and interpret what occurs between the few, sparse, valuable datapoints available. This is very much biased towards an exploration workflow. When I started working with production teams to discuss their software needs in terms of mapping, it was clear that value propositions which resonate well with exploration teams, really don’t appeal to production teams. For example, Petrosys PRO tools to control the gridding process manually (e.g. Sampled Data Editor) or editing tools to change the structure manually (i.e. the Spatial Editor), were not of interest. Below, I’ve put a short list of what I see as being the priorities for subsurface mapping in production teams. Have I missed any? Or do you disagree that there should be a difference between exploration and production subsurface mapping techniques?
Does it matter?
Before looking at what the differences are, it would make sense to ask why we are interested. After all, if there’s no industry requirement to make production maps then the differences are not really relevant in practice. However, this doesn’t seem to be the case. If anything, the opposite is the case, where the big drive at the moment is to maximise recovery through production, rather than discover more hydrocarbons through exploration. For example, Figure 1 shows the number of exploration wells drilled in the North Sea. It’s fairly clear that the number of exploration wells is dwindling.
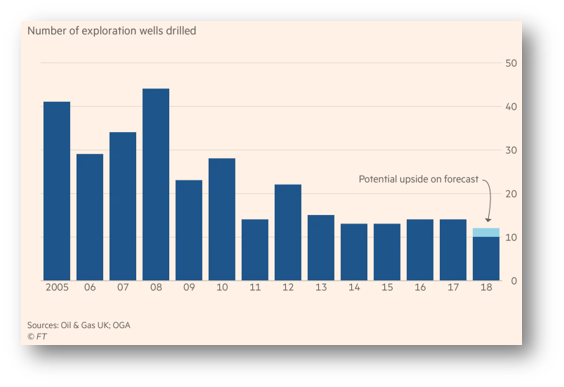
Figure 1 from https://www.ft.com/content/d91b0184-90ec-11e8-bb8f-a6a2f7bca546
In contrast, the number of production wells is increasing (see Figure 2). The point of this article is not to review these trends in any detail but I think at the very least it’s acceptable to say that production is currently very important in the industry, so presenting accurate views of production data on maps is equally critical.
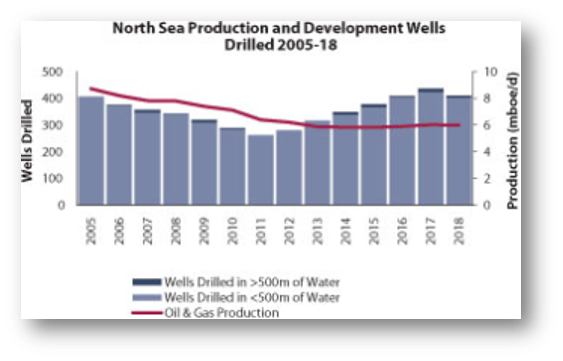
Figure 2 from http://www.drillingcontractor.org/rally-in-the-north-sea-29604
What are the key differences in techniques?
The main differences I tend to see are that the focus is all on the wells (as opposed to seismic or other data), there is a need for automation due to the volume and changing nature of the data, and similarly, because the data are always changing, the way the map connects to the data is important.
It’s all about wells
In exploration mapping, a typical subsurface map will show input data (such as GIS data, well data, seismic navigation etc.). However, in production mapping the focus is the wells (although 4D seismic can be important). For example:
- Wells propagating zones
- As is shown in Figure 3, in production mapping, a key requirement is to show where a well path enters, drills through and then leaves a particular zone. With better drilling and geosteering capabilities, wells can track along a zone laterally for long distances. This needs to be shown clearly and an excellent way of presenting this information is through maps in Petrosys PRO.
- Showing well Completions data
- The location of perforations, casing, tubing etc. are not important in exploration. In exploration mapping, these completion data are not relevant as the aim is to interpret and better understand where hydrocarbons may be trapped. In production mapping, you’ve already discovered where the hydrocarbons are trapped and the aim now is to present your intentions for recovery.
- Structure takes a back seat
- This was perhaps one of the most surprising aspects to me as I started to look at examples of production maps. Although the structure of a trap does tend to be shown, it’s often made bland or faded into the background in such a way that your eyes are not immediately drawn to it. Again, the most important feature is the well information. What the structure looks like is kind of irrelevant by this stage (as far as presenting on maps at least) as we know it exists and we know it has trapped hydrocarbons.
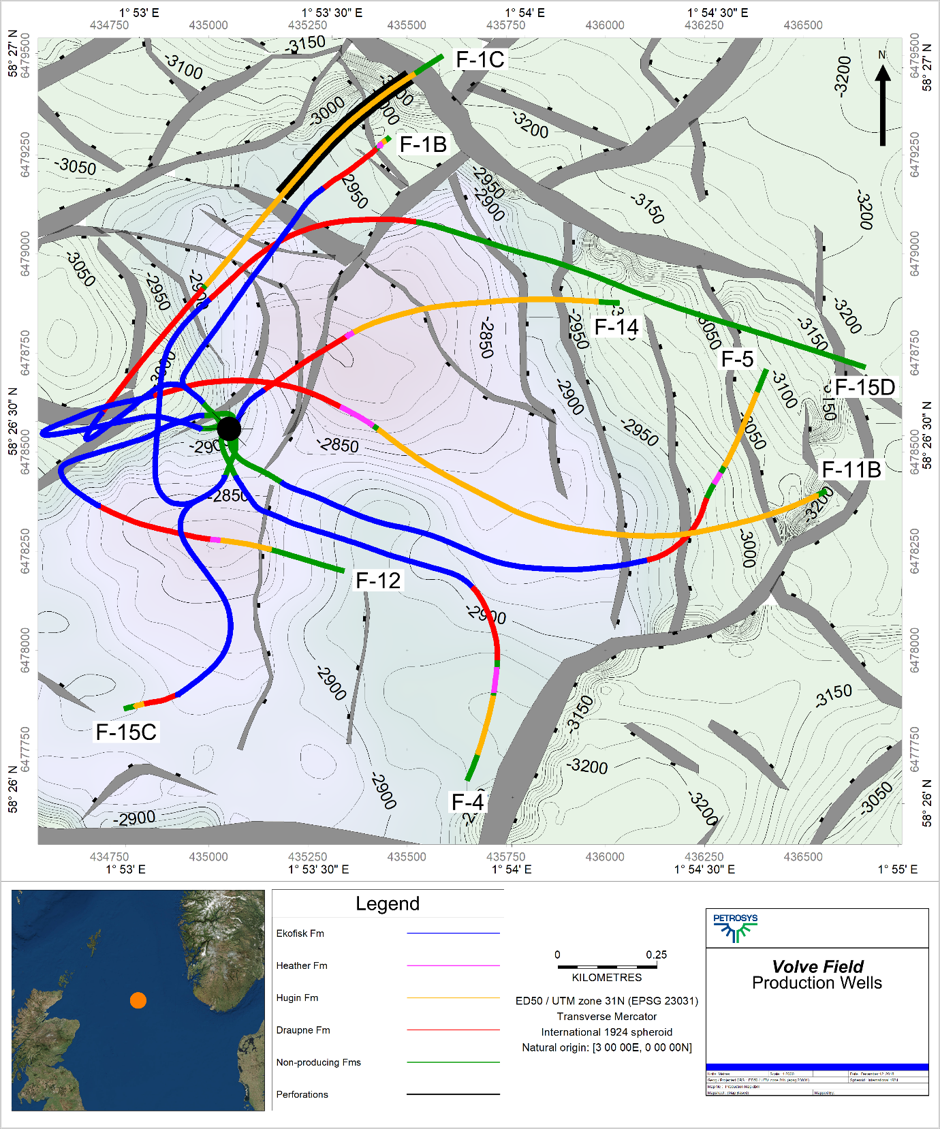
Figure 3 – Typical production map, showing wells propagating through producing zones and completion data (perforations) in the foreground with a faded (and rather poor) structure map in the background.
Automation
- Automation is great for efficiency but in exploration, it has to be used with caution. With limited data control points, there are many ways to contour a dataset. Automation, without proper QC stages, will lead to errors. A lot of exploration data come from adhoc or paper sources as well, for example journal articles or reports which allow the geoscientist to assimilate and form better interpretations. However, by the production phase, data are abundant. Combined with data in regular formats, constantly changing, means that automation is the only feasible way to update maps. Petrosys PRO’s surface modelling module allows for this using its ‘looping over workflow’ functionality (there’s a n example of this in the Petrosys Overview video – https://youtu.be/KspblFBzKpQ?t=113).
Connection
- A similar theme is connections to other data sources. Since exploration data tend to be fairly static and geoscientific in nature, the sources are usually predictable. However, production data can often come from engineering sources. In addition, because of the transient nature of the data, production maps must point to real-time data to be updatable and useful. At Petrosys we invest heavily in our connections and Petrosys PRO has real-time connections to a variety of 3rd party software.
Conclusions
I feel confident saying that exploration mapping and production mapping require different tools and thought processes. Exploration mapping tends to involve sparse, static data with the key skills being explaining what is happening between the data points. In contrast, production mapping tends to involve lots of wells, which are continually being drilled with the key skill being how you show the map reader where each well is positioned in 3D space and what type of completions have been used. Petrosys PRO can do most of these but we are continually on the lookout for opportunities to improve the tools in our software and are currently in the process of implanting some production mapping-specific changes for PRO 2019.1 release.
What do you think? Are the differences listed here the main ones or are there others? Or do you disagree with this list? It would be great to hear what the term ‘production mapping’ means to you.