

A little known, but very useful, feature of the 3D Viewer is the ability to create time lapse movies to watch an attribute change over time. There are many applications for this in G&G workflows, for example draping a series of reservoir pressure maps over a structure grid.
The option works particularly well with a surface modeling workflow that creates a series of grids as the input data changes over time.
The example below demonstrates how this works. It uses mean wind speed data over a year draped over a digital elevation model. In this example, the input data came as ASCII grid files including the year and month in the filename.
In surface modeling:
- Import the ASCII grid to a Petrosys grid. The second task here smooths the input data which was noisy.
- Loop over the tasks and script the input and output file names so that the correct year and month are written into the final output grids.
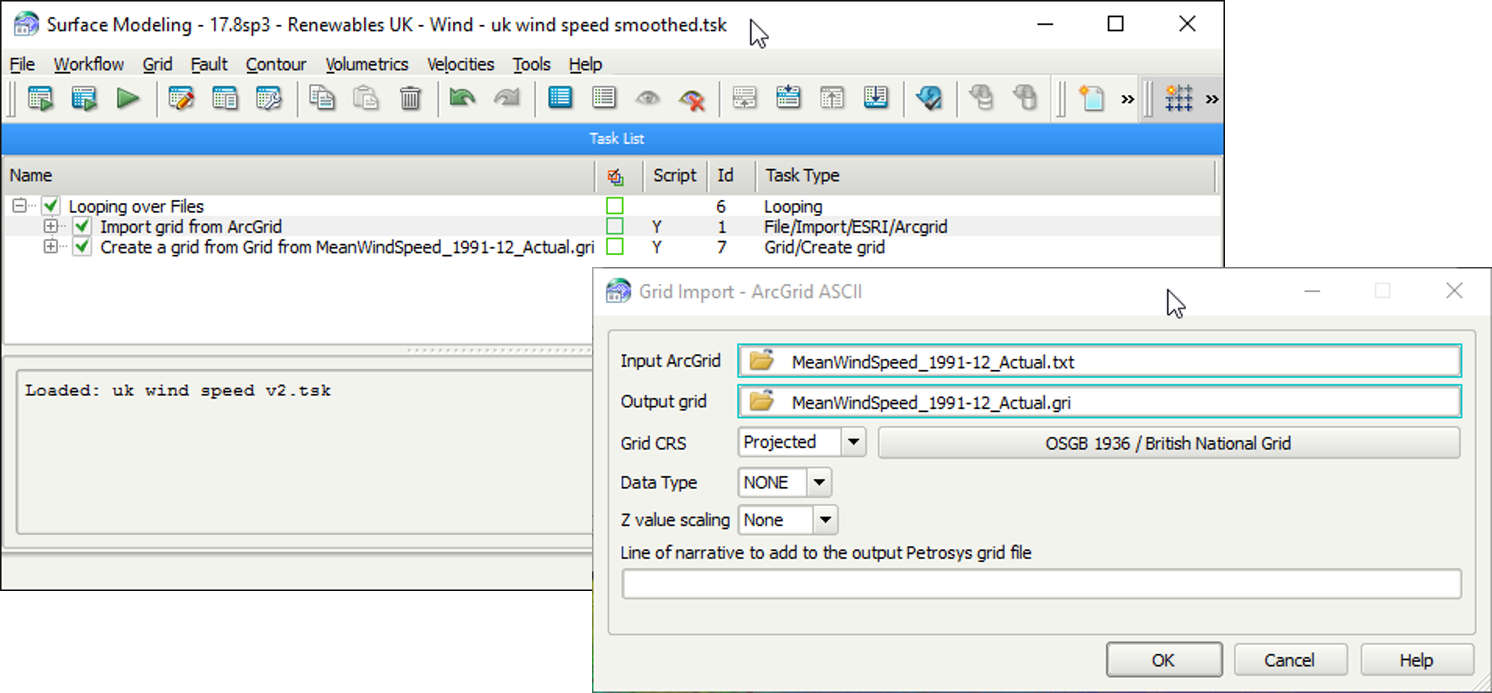
- Note that from Petrosys 17.8, scripted parameters are highlighted in panels with a turquoise border (see above).
In the 3D Viewer:
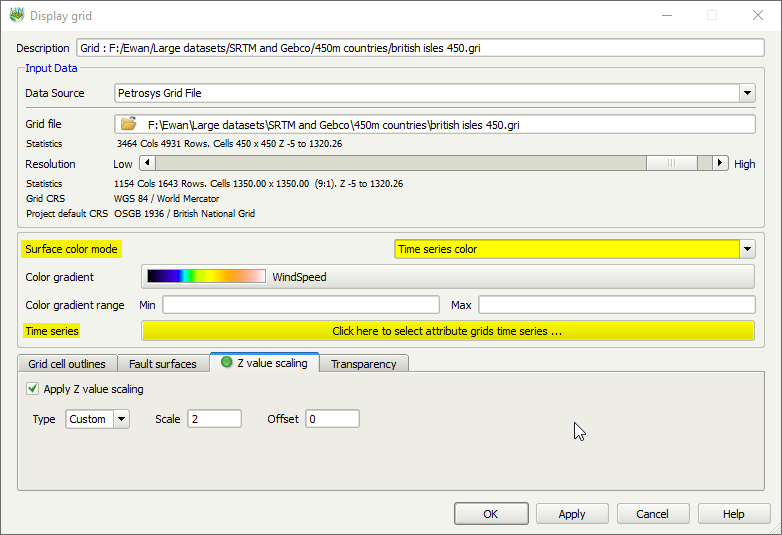
- Display the structure grid as required (vertical exaggeration, angle, resolution, etc.).
- Set the Surface color mode option to Time series color and select a suitable Color gradient.
- Click on the button to the right of Time series.
- Add each grid created setting the appropriate Period type [options are: Weekly, Monthly, Quarterly, Half Yearly, Annual]. Set the time units for each grid – the up and down arrows can be used to cycle through the time units.
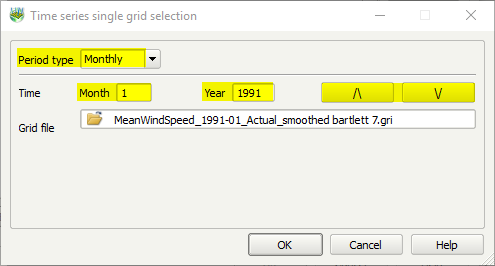
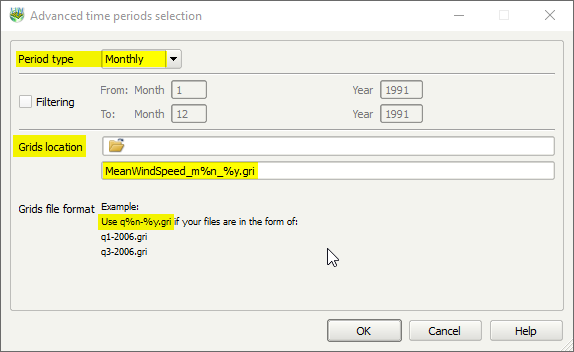
Repeat this for each grid if the grid names are inconsistent. - There is an Advanced option that allows multiple grids to be selected at once providing they are in the same directory, consistently named and the description of the time units matches the specified syntax described in the help. The time units should be at the end of the filename, as below:
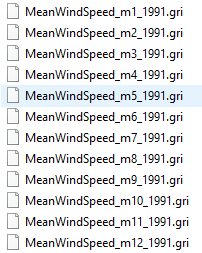
In the Advanced panel set the correct Period type, choose the folder that grids are stored in (don’t worry that the file path doesn’t appear). Most importantly, make sure the syntax matches the example in the panel. This will automatically select all the grids in one step.
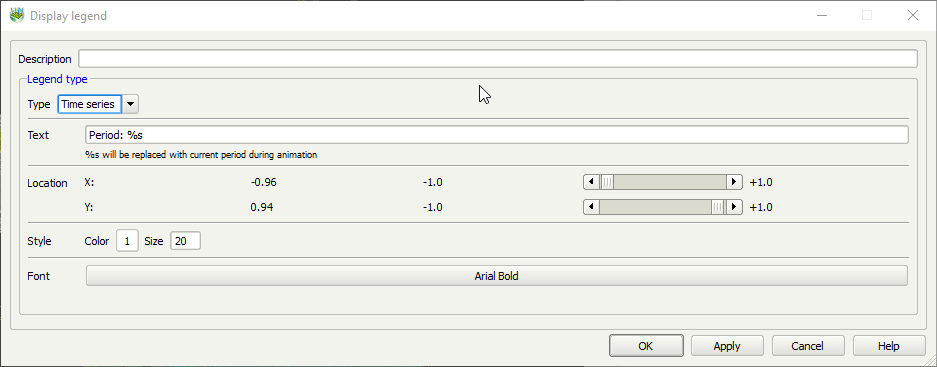
- Display/Legend to see the time measurement displayed with each grid:
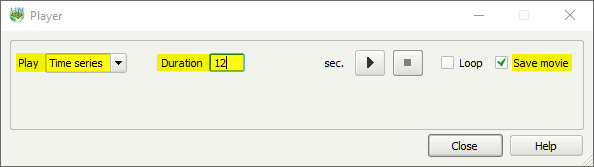
- Select Viewpoints > Animation or click the Animation icon.
- Make sure Play is set to Time series, set the Duration of each frame (in seconds) and there is an option to save the animation out to an MPEG file for easy sharing. Press the Play button to start recording:
- You will now be able to see a series of frames showing the attribute change over time: