


Regional Mapping of Key Reservoir Horizons
A regional exploration team at a large NOC needed to map key reservoir horizons across four producing oil fields, that while geographically adjacent to each other, were for a period of more than 30 years developed separately, where there was no exchange of knowledge between the separate Asset Teams.
A small team of Petrosys consultants were deployed on rotation to install Petrosys PRO software, to establish the data exchange links to third party applications, and to develop the workflows to build the regional maps for seven key horizons.
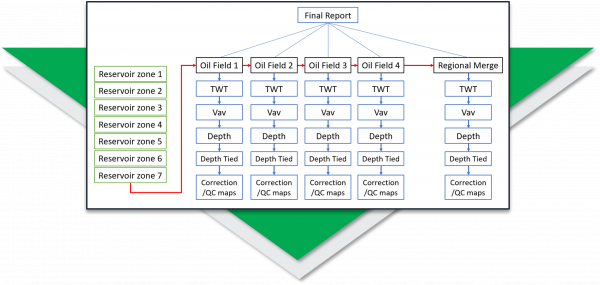
Drawing on the final TWT interpretation and the Velocity data from each of the four Assets, intuitive and interactive workflows were built to generate each Assets well-tied depth horizons and regionally merged and well-tied depth horizons.
In addition to creating the regional maps for the seven merged and well-tied depth horizons the project delivered:
- a documented workflow ensuring the repeatability as new interpretation became available
- the optional delivery of the product depth grids back into the preferred interpretation solution
- knowledge transfer in both domain expertise and future workflow configuration
The value of the Petrosys Consultant on this project was:
- domain expertise delivering results quickly by addressing the identified technical challenges
- a complete catalogue of maps for the seven key events, with the capability to reproduce and update them at any time
- staff were able to focus on their areas of expertise but able to adapt and incorporate new best practices for when it was required again
The challenge:
Map key reservoir horizons from multiple oil fields all operated by different teams with consistency.
The Technical Objectives:
- Install and configure an advanced mapping tool (Petrosys PRO) to connect directly to data across 4 asset teams
- Connect to seismic and well interpretation where available (TWT, Vav, Depth) for 7 reservoir zones across the 4 asset teams
- Create TWT maps, Vav maps, depth convert surfaces, tie to well data, and analyse correction/QC maps
- Adjust models as necessary and re-run
- Merge all maps into a regional model
The Deliverables:
- 175 maps
- Report and presentation documenting the process and the results
- Re-usable workflow which can be re-run as interpretation is updated
- Training on the software and the workflow