With the release of Petrosys PRO 2018.3, new functionality has been added that allows users to generate a complete well penetration report by just running a single task.
This new tool calculates accurately the XYZ location where a well track intersects an interpreted horizon.
The report accepts as input not only well data from all the 3rd party sources you are familiar with, but also accepts point data from sources such as GIS or Excel spreadsheets.
Regarding the surface to be used for the intersection, grids from the Petrosys’ own format and from supported 3rd party packages are accepted (i.e. Petrel, IHS Kingdom…)
The great benefit of running this report is that users can select multiple grids from the data sources available.
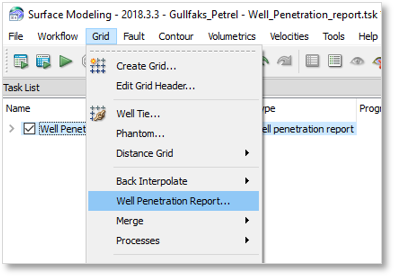
To generate a report, go to the Grid menu in Surface Modeling and select Well Penetration Report…
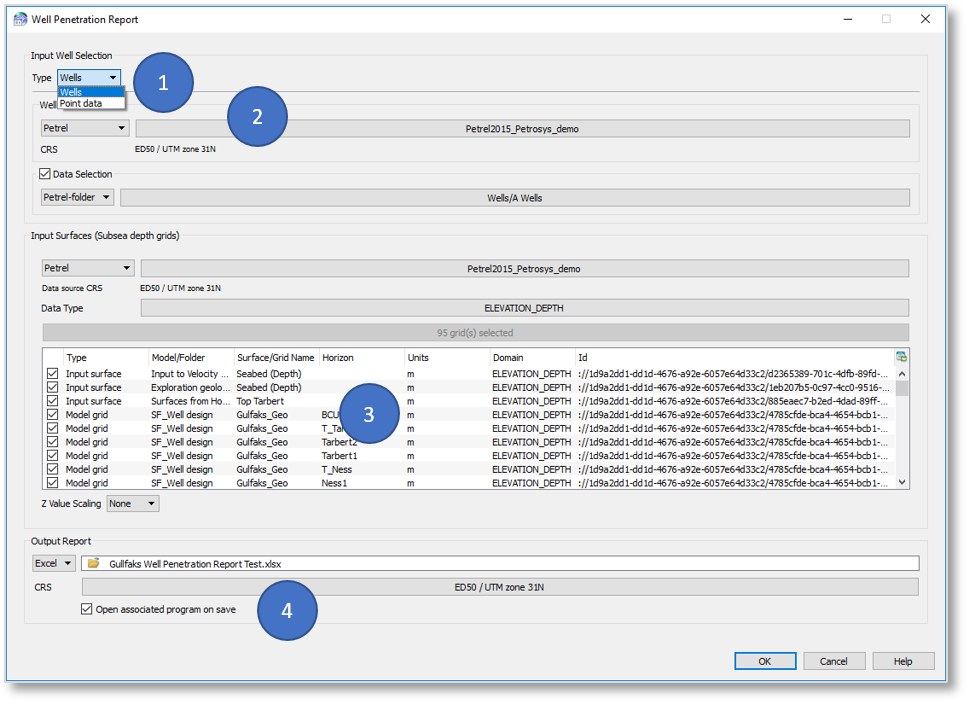
Once in the relevant panel, populate the parameters accordingly:
- Select the type of input well selection: wells or point data
- Select the well data source and domain, i.e. Petrel,
- Select as many input surfaces you would want to use in the report
- Select the desired type of output for the report
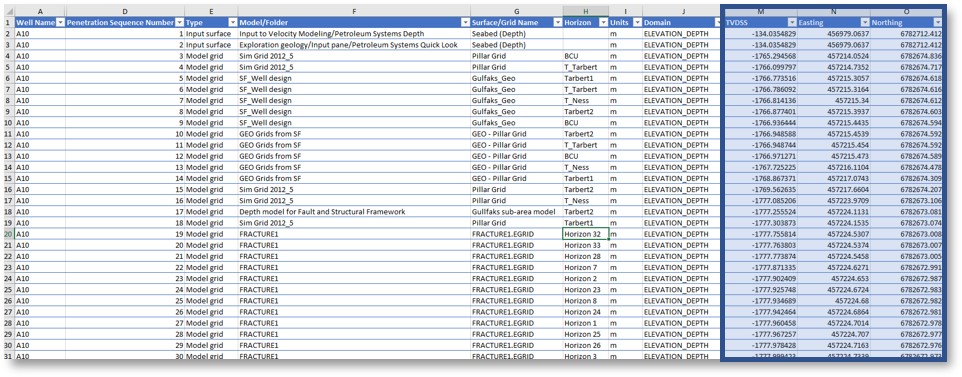
Once you run it, depending on the options selected, you’ll get a similar report to the one below, where you will get the intersections (XYZ) for all the wells with every grid selected above.
This type of report is frequently used for reservoir appraisal and development.