

Bubble maps are a great way of applying a spatial context to production attributes linked to each well.
In Petrosys PRO you can create bubble maps using data from most of the EP well data stores that connect to PRO. Data from text is also supported, such as CSV and other column based files.
Bubble maps can be created not only from well header data but from formation and zone attributes too. Production rates could be used to scale the size of each bubble and, if you have defined more than one attribute the bubbles will be displayed as pie-charts, with the numeric value of each attribute being used to work out the proportion of the pie.
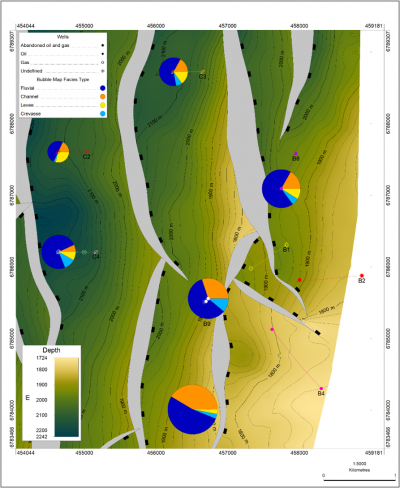
Aside from the typical production attributes, we can also map facies distributions across a specified zone or formation.
For example, the map below is showing the percentage of fluvial, channel, levee, and crevasse facies within the Top Ness formation. The facies % is computed from a discrete log in Petrel and, if it is assigned to a Petrel zone or formation, it can be mapped in Petrosys PRO.
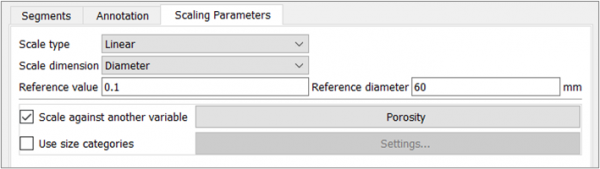
You can also include a formula to compute appropriate derivatives. For example, you can complement water saturation (SW) with a formula such as (100-SW) for the hydrocarbon saturation. And lastly, bubble sizes can be scaled either on diameter or on the area and compare the sum of the mapped parameters against a user specified reference value and size. Area scaling is preferred for visual correctness.
Quick Tips on Creating a bubble map in Petrosys PRO
Create a bubble map showing facies distribution across your formation interval.
- The facies % is computed as a discrete log in Petrel and, as long as it is assigned to a Petrel zone or formation, it can be mapped in Petrosys PRO.
If necessary, create a formula to compute derivatives or find missing values e.g.
- Fluvial = 100 – (channel + levee + crevasse)
Choose whether to scale each bubble by an additional variable (e.g. porosity) and set up the scaling parameters to control the relative size of each bubble
- Linear or logarithmic
- Set reference values
For more watch the short video below ‘How to display facies as Bubble Maps.
Get in touch
If you would like to know more about Petrosys PRO contact our team of mapping gurus.