

Bubble maps, whilst similar to point maps, not only display data at locations but they also exaggerate the size of the point based on corresponding data values. They are also used to display pie charts at locations.
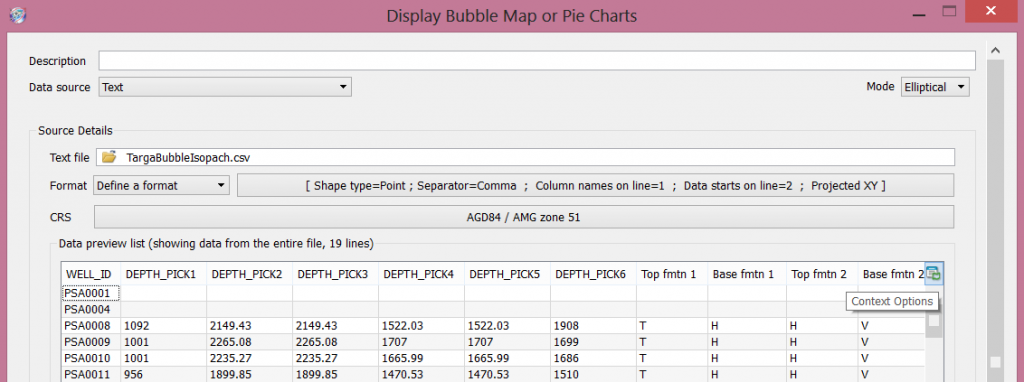
In Petrosys, bubble maps can be accessed via the Mapping module by navigating to Display > Bubble Map… There are a number of available data sources for generating bubble maps including Excel spreadsheets, text files, culture files and a number of 3rd party data sources like Geoframe, OpenWorks, dbMap, IHS Kingdom, GeoGraphix and Finder.
Values associated with a bubble map can be presented in 3 ways:
- A bubble whose size and/or magnitude is represented by a single data value.
- Pie chart which represents portions of each data value in comparison to total data value under a single well, such as formation thicknesses in each well.
- Elliptical bubble map to model direction and magnitude of vector data.
There are 3 filtering options available for bubble maps:
Data Preview filtering
The Data preview list can be used for QC and filtering. This can be done by clicking the filter button at the very right of the header column.
Note that this type of filtering will not get translated to the bubble map display as it is only a display option for the values within this pane.
Bubble map data filtering
Filtering data to be displayed on the bubble map can be done in the Filter field below the Data preview list. As an example, the filter rule expression used below will only post bubble map values equal to or exceeding 500m thickness from Isopach_1 and equal to or exceeding 400m thickness from Isopach_2 variables.
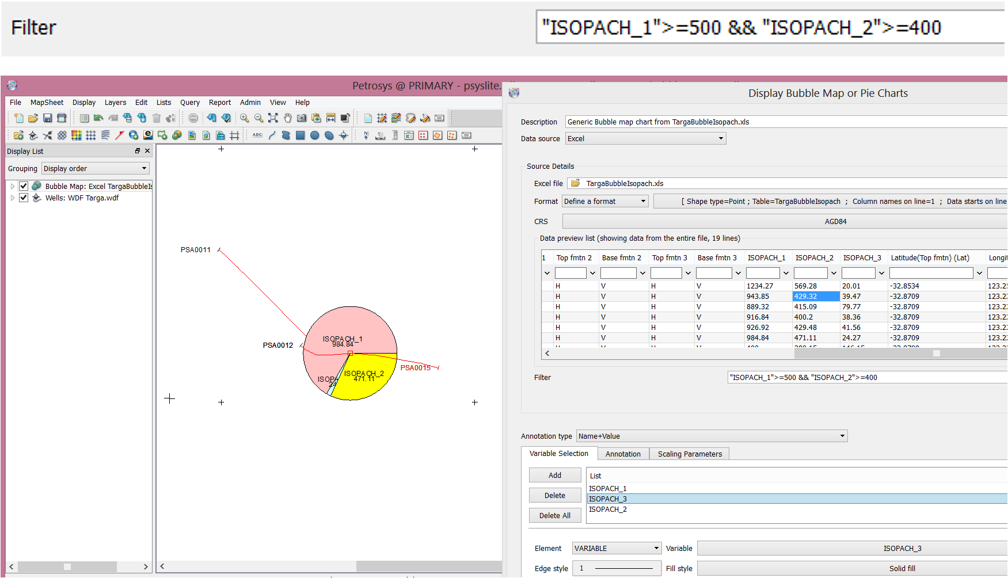
Adding variables to the bubble map is done under Variable Selection. The defined styling will be applied on the highlighted variable selection and needs to be done item by item (so you will need to repeat the styling steps when adding more variables).
Bubble Map Scaling
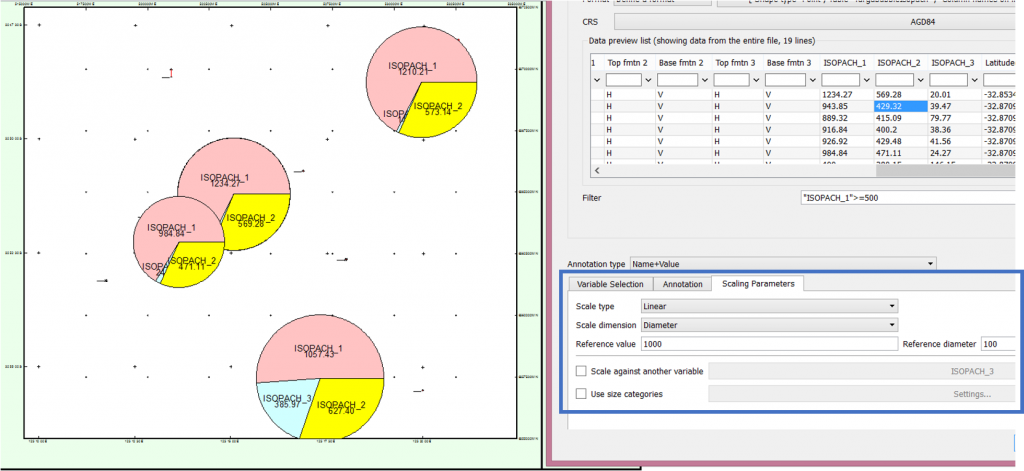
You may choose to display numerical events in a subtle manner or simply choose to exaggerate events by selecting the right scaling parameter which you can set via the Scaling Parameters tab. There are 4 types of scaling parameters:
- Constant
All bubble map diameters will be the same size as defined in the Reference diameter field. No Reference value is needed to be associated with the Reference diameter. - Linear, Area
Based on the value of ISOPACH_1 in the spreadsheet, the maximum is around 1200. The Reference value of 1000 will display a reference bubble area of 100. If the Reference value is 2000, the bubble area will double the reference size. The change of Reference value corresponds linearly to the bubble area so when you select the Reference value-Reference diameter pair, do take into account the minimum and maximum value ranges and input the right reference value corresponding to the bubble diameter (so that the bubble displayed will not end up being too small or too big). This will exaggerate the values based on bubble area. - Linear, Diameter
The difference between Linear/Area and Linear/Diameter is that a Reference value of 1000 corresponds to the bubble Reference diameter of 100. A value of 2000 will double the size of the bubble diameter. - Logarithmic
With this option Reference value will correspond in a logarithmic manner to the Reference diameter. It is usually used to display when scaling against other data has a huge range of values such as permeability. Scaling against another variable will help you determine the magnitude of how much an attribute (such as porosity, thickness, permeability, etc.) affects each variable selected.
You should now be able to display impressive bubble maps using various information to achieve the desired outcome!