

Petrosys version 17.4 will see the introduction of point data display to the 3D Viewer. Introduced for the display of microseismic, 3D display of point data serves a wide range of purposes making it an invaluable addition to the increasingly robust range of functionality available in the 3D Viewer.
Point data can be displayed directly from text or Excel files, shapefiles, Petrosys culture files and Petrosys sampled data (GIP) files, and is represented within a 3D visualization as either a sphere or a cube, which will be centred on the coordinates provided by the chosen data source. The size and color of each point may either be specified manually, or set using attribute values from the data source, allowing physical attributes to be effectively modeled in three dimensions.
Combining attribute modeling with point data display allows new data types to be displayed by the 3D Viewer, and allows various tasks – particularly involving the testing and QC of interpreted surfaces and horizon picks – to be performed which weren’t previously achievable.
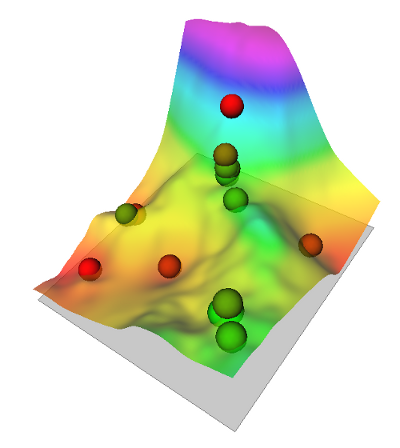
A visual QC check of well picks against a tied grid. In this case the displayed points are the input data for a well-tie task. Those points are being displayed using a color gradient which starts as red, green in the middle and red again at the end. In other words the red points lie at either end of the Z range.
Microseismic data, which is typically stored as a point data, can now be added to a 3D visualization. Attributes associated with a microseismic data set can be modeled using either the size or color of each point, allowing seismic exploration data to be represented by the 3D Viewer in far greater level of detail.
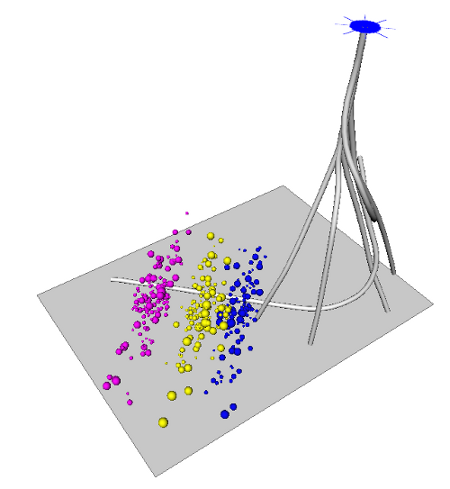
Microseismic data, stored as batches in multiple sheets in an Excel file, displayed against a well track. Each batch has been assigned a constant color, but has been sized using one of the microseismic data columns.
Point data can also be used to represent fault sticks, providing an additional means of performing quality control checks on faults in 3D surfaces, and allowing fault data to be represented far more effectively in three dimensions.
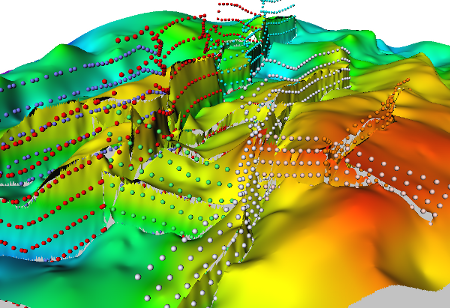
Fault stick data displayed against the associated faulted grid. The points used in various fault sticks have been saved in text files, which are displayed using a constant color and size.
The addition of point data visualization greatly increases the diversity and applications of the 3D Viewer application, making an already versatile application into an indispensable part of the Petrosys application. Look for 3D point data visualization in the Display menu of the 3D Viewer in Petrosys 17.4.