

First, let’s forget about import. Petrosys PRO reads spreadsheets and ascii delimited files directly, no data duplication – update your spreadsheet, and your map updates too.
How does it work?
Mapping
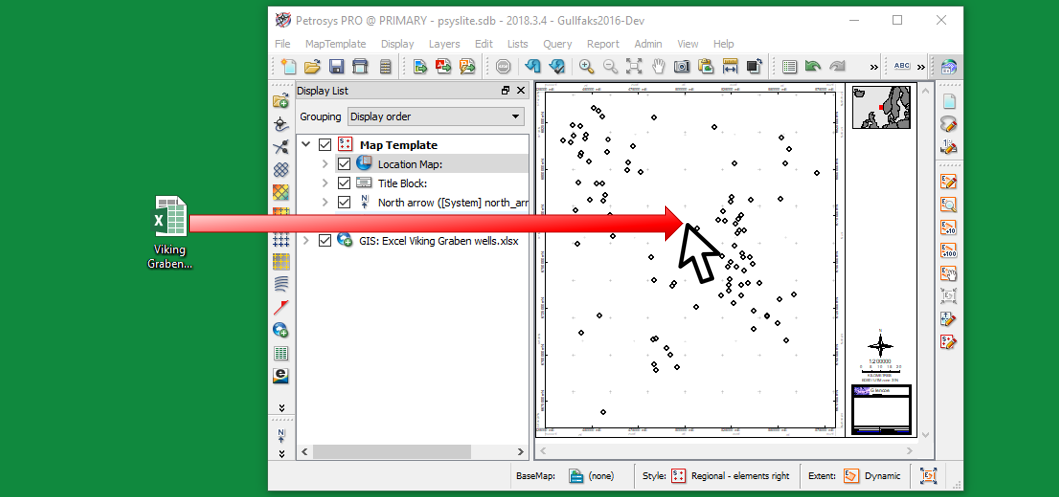
If your file has columns of data, drag and drop it onto the Petrosys PRO map and the chance are your data will appear!
There are some smarts that will try and pick up the format automatically, but it helps to have sensible column headers
It’s worth checking the auto-generated format. It will let you:
- Specific the coordinate reference system the coordinates are in
- Make sure the correct coordinates are selected e.g. you may have a choice between well top-hole coordinates and the coordinates for a formation top
- Choose which attribute you want to show as the z-value, each column is treated as an attribute and will be available if it has a number format
- Define whether you want to display the coordinates as points or lines/polygons
Petrosys PRO treats spreadsheet data as generic point, line or polygon data which means you have the same range of display options as you have for GIS data:

- Annotate your map with values from any column
- Perform multiple level filtering to view only a subset of your data e.g. only show formation X, where the z-value is greater than 2000
- Thematically map the data e.g. apply a colour gradient to the points based on a z-value, or thematically map well symbols to a code number in the spreadsheet
- Move annotation labels so there is no over-posting
- Query attributes
- Calculate the areas and centroids for any polygons

 Spatial editor
- Open and edit Excel spreadsheets
- Create a new Workbook and spreadsheet and digitise coordinates straight into it
- Add and edit attributes (columns)
- Back interpolate coordinates and z-values from a grid to a spreadsheet
Surface modelling
- Use your spreadsheet as input data for creating a grid (hint: input data type is “Point data”)
- Set missing value, apply shifts or factors to the z-value e.g. for unit conversion
- Combine data from other sources in the same grid e.g. create a bathymetry grid from well water depth values in a spreadsheet and bathymetry contours in a shapefile
- Create a workflow to loop over attributes in a spreadsheet e.g. auto-generate grids and maps from a spreadsheet with columns for porosity, permeability and water saturation
- Use point data in a spreadsheet during a well-tie with grids from an interpretation system
Exchange and creation
- Convert spreadsheet data into other formats e.g. write the data into a shapefile or directly into Petrel. Filter the data written by attribute or area of interest.
- Create an Excel spreadsheet well penetration report – calculate the XYZ (or lat/long/Z) of all formations along a well path with the associated meta-data
Bored yet? There’s so much you can do with spreadsheets in Petrosys PRO! One last thing, if you just want to display a spreadsheet as a table on your map, you can do that directly too. Same thing, update your spreadsheet, and the map updates too.