

The next generation of Petrosys software – Petrosys PRO 2017.1
Featuring not only a new name and new look & feel but a huge advance in how corporate mapping standards are applied across regions. Petrosys PRO 2017.1 will bundle the map canvas, surface modeling and volumetrics, providing users with access to a cloud hosted stochastic resource calculator, a spin-off from the Petrosys Prospects and Leads system PLDB.™
Here is a sneak peak of some highlights.
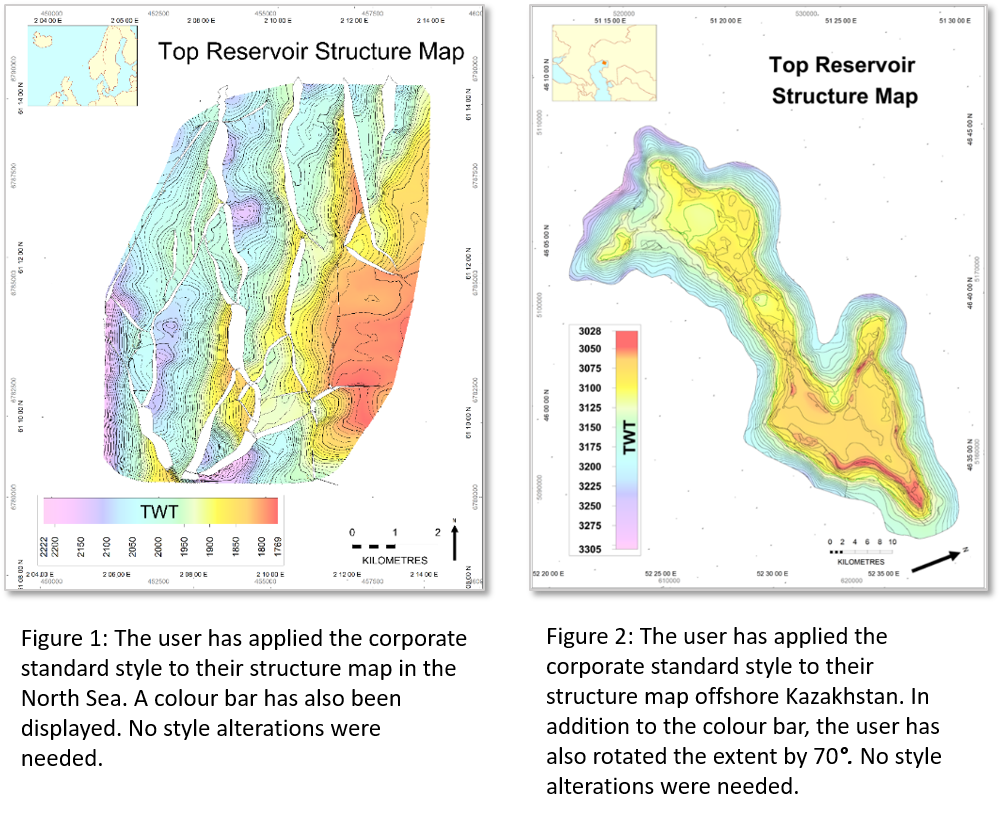
Map Templates
Map Templates (the replacement for Map Sheets) allow the Style, the Extent and the Page Size & Scale of a map to be distinct. This allows a set of corporate standard ‘styles’ to be created. Users can then apply these styles to any ‘Extent’ and to any ‘Page setup and Scale’ as needed. Thus, the workflow to create a map is significantly shortened and the concept of Mapping Standards can be more easily implemented.
 Petrosys are keen on working with clients on applying the new map style tools to enable existing and improved corporate map standards on the desktops of their subsurface teams. Contact your local support team for more information.
Contour and Interpolation Improvements
Contouring and interpolation of contours in cells surrounding faults has been improved to provide;
- Better definition of surfaces with shadow areas and discontinuities around faults (no more refraction affects).
- Better definition of contours in flat areas when grids are clipped to min/max values (no more ring contours generated).
- Improved contouring around faults to prevent crossing contours
- No discontinuities in interpolation over cells edges
- Better stitching of interpolation across polygons and faults
Below is an example of improvements showing the display in 17.8 versions of Petrosys on the left and the new contour/interpolation rendering in Petrosys PRO 2017.1.
Shadow area Improvements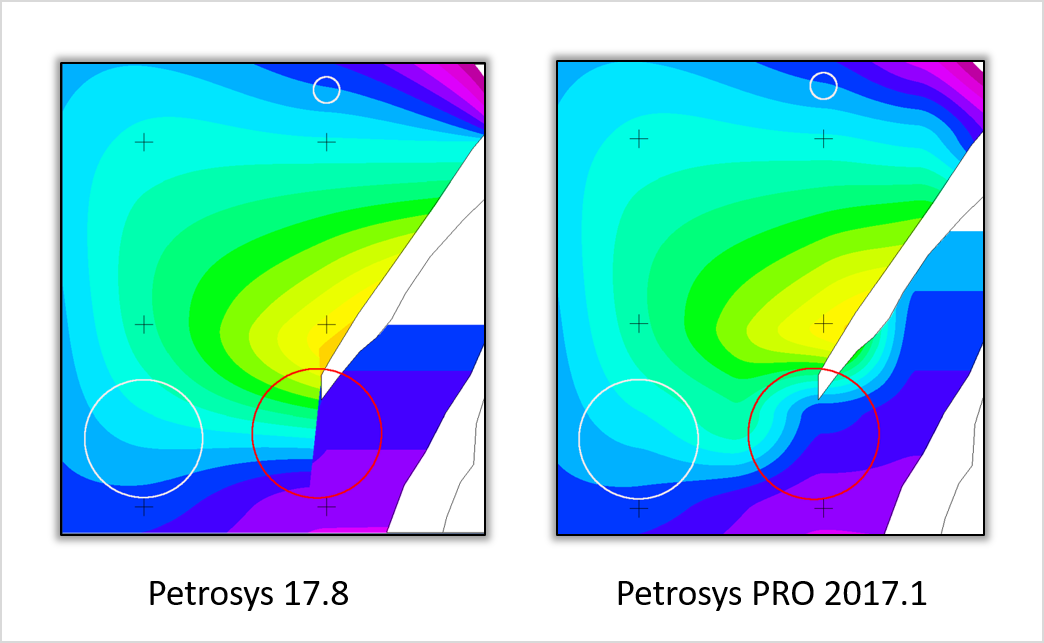
Refraction of surface at the end of the fault is now better interpolated and a more continuous surface is rendered (see area in red circle). The same grid is displayed in each version of the software.
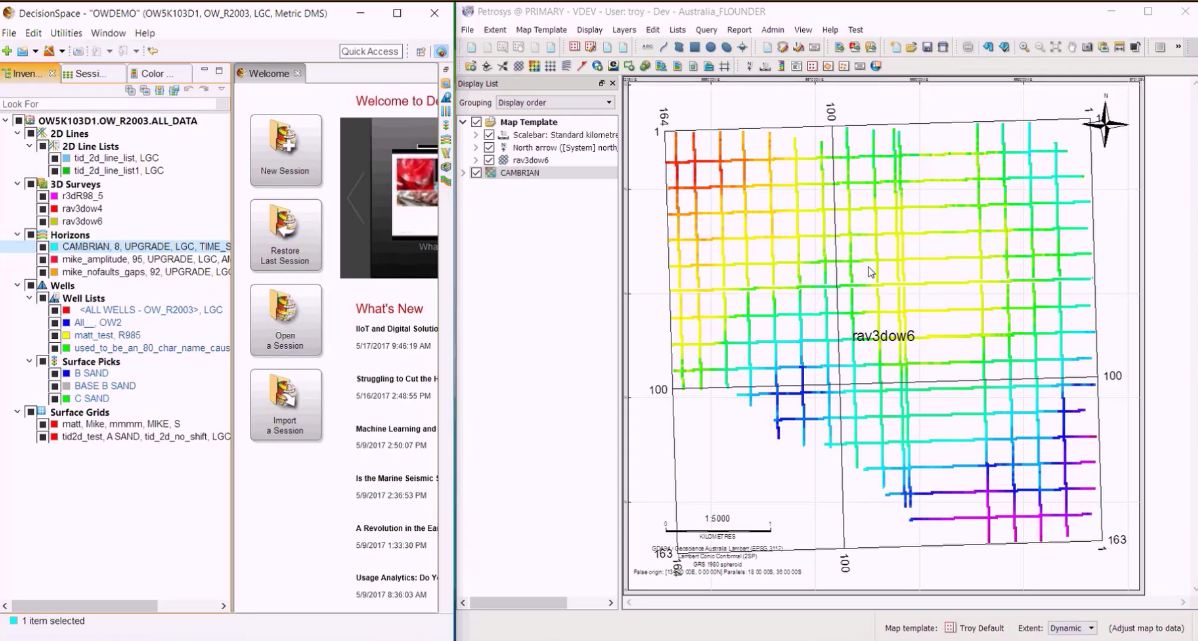
DecisionSpace® Drag and Drop
Data can be displayed in Petrosys by dragging and dropping from the Landmark’s popular DecisionSpace application Drag Openworks data from the DS inventory and drop in the Petrosys map or Surface Modelling data input. Supported on both Linux and Windows.
Supported data types include:
- 3D Seismic navigation and interpretation
- 2D Seismic navigation and interpretation
- Wells – top and bottom hole locations, deviation surveys, formation tops
- Surface grids
- Fault polygons and sticks
- Cultural polygons
Faster and more intuitive experience for DecisionSpace users. Saves time by avoiding searching for data through menu-based dialogues.
Petrel Updates
Petrosys PRO 2017.1 significantly improves the functionality of the Petrel connection.
Geopolygons are now supported for display in mapping; they can be edited with the spatial editor and the spatial data translator can write them out to other data-types, or write suitable datatypes to geopolygons in Petrel.
Petrosys Lists menu now supports Petrel 2D Seismic folders to filter data. The subset of lines can then be saved as a line selection file for display and gridding.
In Petrel, the color can be set for a specific well, a wells folder, or formation. Petrosys well display now allows the Petrel color to be selected and displayed. Petrel users are often familiar with the color used in their project and would like them replicated with no effort when mapping in Petrosys.
3D Viewer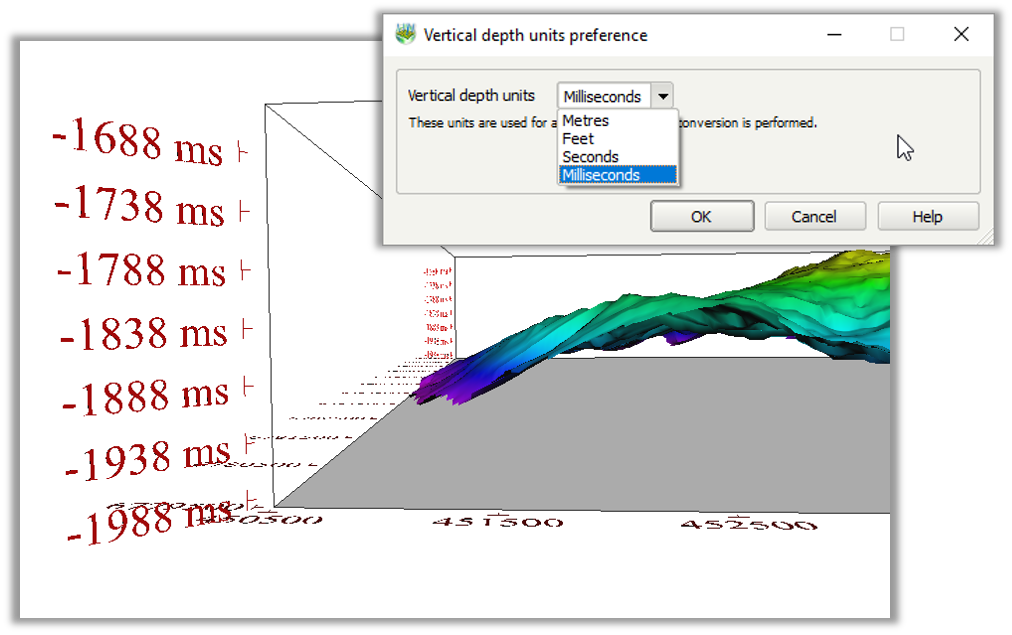
With well databases or multiple high resolution grids, switching from dynamic mode to a fixed extent greatly improves performance. Also an excellent way to remove bad data points without needing to create a selection list.
In the 3D viewer, time units (seconds and milliseconds) can now be chosen to annotate the Z-value axis. Changing the units does not perform depth conversion.
For more information on Petrosys PRO 2017.1 contact your local Petrosys office.