

The Petrosys commitment to value – added agile development continues with the release of Petrosys PRO 2018.2. The first up-date to Petrosys PRO 2018 is a significant up-grade and not just a patch release.
We are always striving to deliver greater function to clients and as such this is the 3rd major release in the Petrosys PRO series in the last 12 months.
Highlights of what’s new:
Probabilistic Resource Calculator
 Petrosys has added a new option to compute a range of outcomes for Oil and Gas volumes using Monte-Carlo simulation via the dbMap/Web Prospects & Leads Resource Calculator with input from two or three Volumetrics runs.
- Choose one of the supported PRC compute methods – Depth-Volume Method, Depth-Area Top (Constant Thickness) and GRV Method
- Choose the desired distribution type – Normal, Lognormal, Triangular or Stretched Beta
- Choose the hydrocarbon type – Oil, Gas or Oil & Gas
- Enter details for the Low & High Percentile, and Mode, depending on the distribution type selected
- Select either separate grids defining your low & high estimates, or select the same grid in both cases, and vary the contacts
- Contact level names are fixed and values mandatory, based on the PRC Compute method and Hydrocarbon type selected
When the task is run, it will run the standard Grid Based Slices volumetrics for each of the grids input in the Low/High Percentiles & Mode tabs.
 Once complete, the data is securely sent to a read-only Petrosys-managed cloud dbMap/Web instance, which is restricted to only support PLDB Resource Calculator for the PRC. Some mandatory and other optional input distribution values can be set on the Geology, Oil, Gas and other tabs, such as Porosity, Net/Gross, Oil/Gas Bg and recovery factors, then pressing Compute will run a Monte-Carlo simulation for the set number of iterations. Resulting volumes are displayed in the Results tabs. and can be exported to Excel for permanent storage.
Note: no data is stored or logged in the cloud beyond the current computation run. A Petrosys Connectivity license is needed.
Direct Display of Excel Spreadsheets on Maps
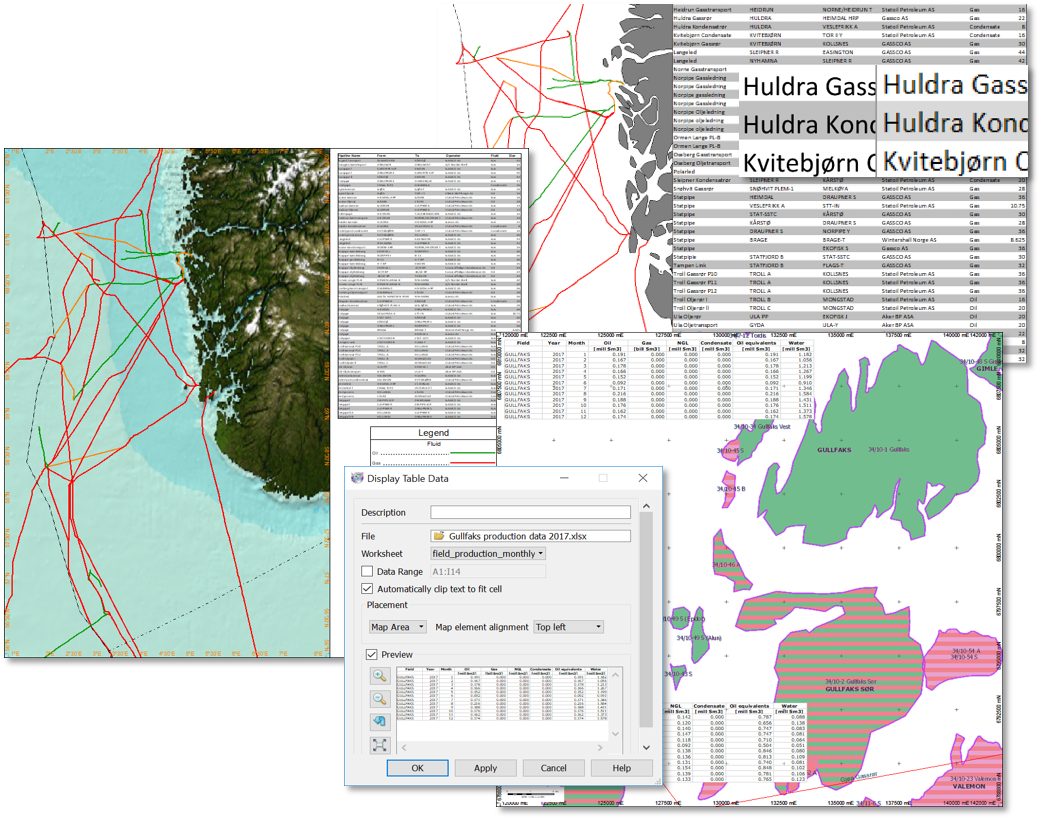 Excel spreadsheet store all sorts of useful information such as engineering data, production figures, volumetrics results, etc. They are also an easy way to view data in delimited text formats. Previously Excel spreadsheets were saved as a raster image and displayed in Petrosys PRO as a picture. The image was static and did not update with the spreadsheet and text could be pixelated when zoomed in.
Excel spreadsheets can now be displayed directly using the Display/Excel Table option. This option allows users to select which worksheet they want to display, and they can also restrict the display to a specific data range.
The display is live, so if the spreadsheet is updated, the data displayed on the map will update when it is refreshed. Text is properly rendered and will always be clear regardless of the zoom scale.
Petrosys PRO 2018.2 – a big release for those working with Petrel
Due to Petrosys’ and Schlumberger’s close working relationship, Petrosys is pleased to support the soon to be released Schlumberger Petrel 2018 in Petrosys PRO 2018.2. Petrel 2018 is supported in all the places you’ve come to expect, including grids, seismic and wells, along with the new structural framework.
In addition, Color bars are now automatically imported and there are significant performance gains with displaying seismic data.
Batch Mapping of Data Over Multiple Extents
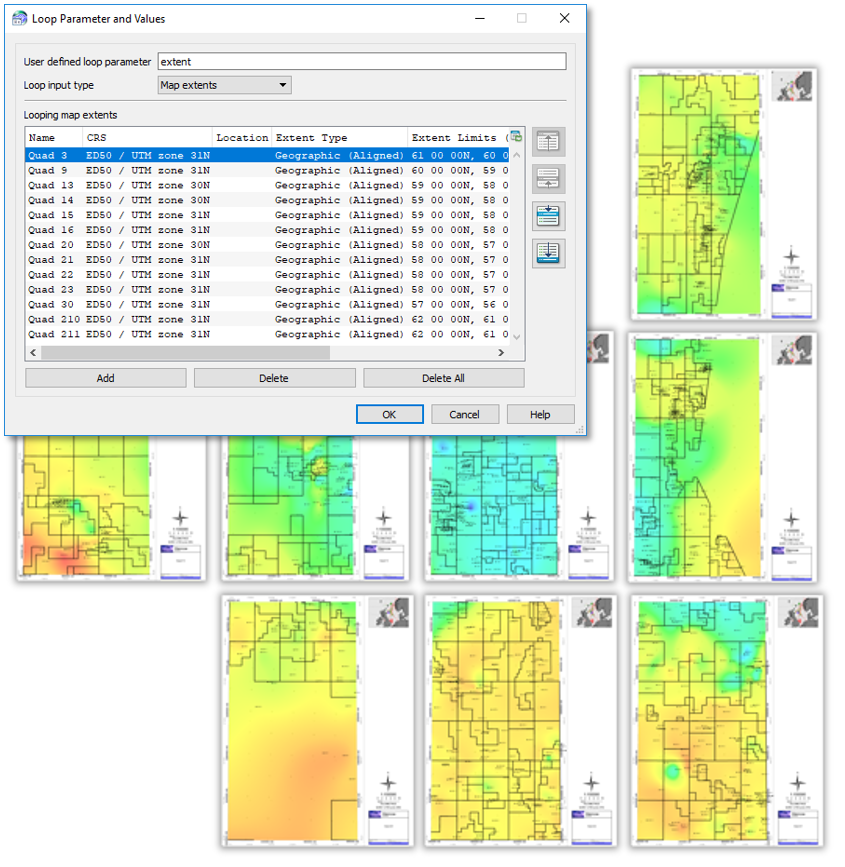 It is often necessary to map the same data types over multiple areas of interest. For example, periodic updates of maps showing a gold standard surface, available wells or seismic, or production pie charts may be required for areas defined by license blocks or field extents.
In Surface Modeling, the Workflow/Loop Over Highlighted Tasks option has a new option to loop over Map extents. In combination with the Tools/Draw Map option, this makes it very easy to create consistent maps over multiple areas and periodically update them, outputting results to PDF, raster images or Petrosys dbm files.
Edit Third-Party Grids, Faults and Clipping Polygons
Petrosys PRO now allows the editing of grids and faults from both Petrel and OpenWorks and clipping polygons from Petrel only, from within the Grid Editor tool. The full suite of Grid Editor features is available, allowing Petrosys PRO’s intuitive editor to modify Petrel and OpenWorks grid data without the need for importing and exporting to and from Petrosys file formats.
Color Bar Added to Map Templates
 Map Template Styles now include the option to include one, or more, color bars. This enforces consistent color bar placement in company approved map styles.
The positioning options are the same as for the other map elements. When the template is selected with no grid displayed, a skeleton color bar with no fill will be displayed. This can be turned off in the display list if required. The next stage is to display a grid or surface. To populate the map style color bar, go to the display list and drag and drop the grid or surface item with the desired color bar to the color bar item in the Map Template group.