

How do I create and/or display contours from a grid?
Typically, the easiest way to create contours from a grid file is to use the /Grid/Create Grid option in the Surface Modeling module. Under the Contour menu, various selections are available to create the contours: the contour min/max, increment, as well as any additional contours you would like created from your grid (for example, an oil/gas contact). This method will save your contours to a Petrosys contour file, specified by the .con extension.
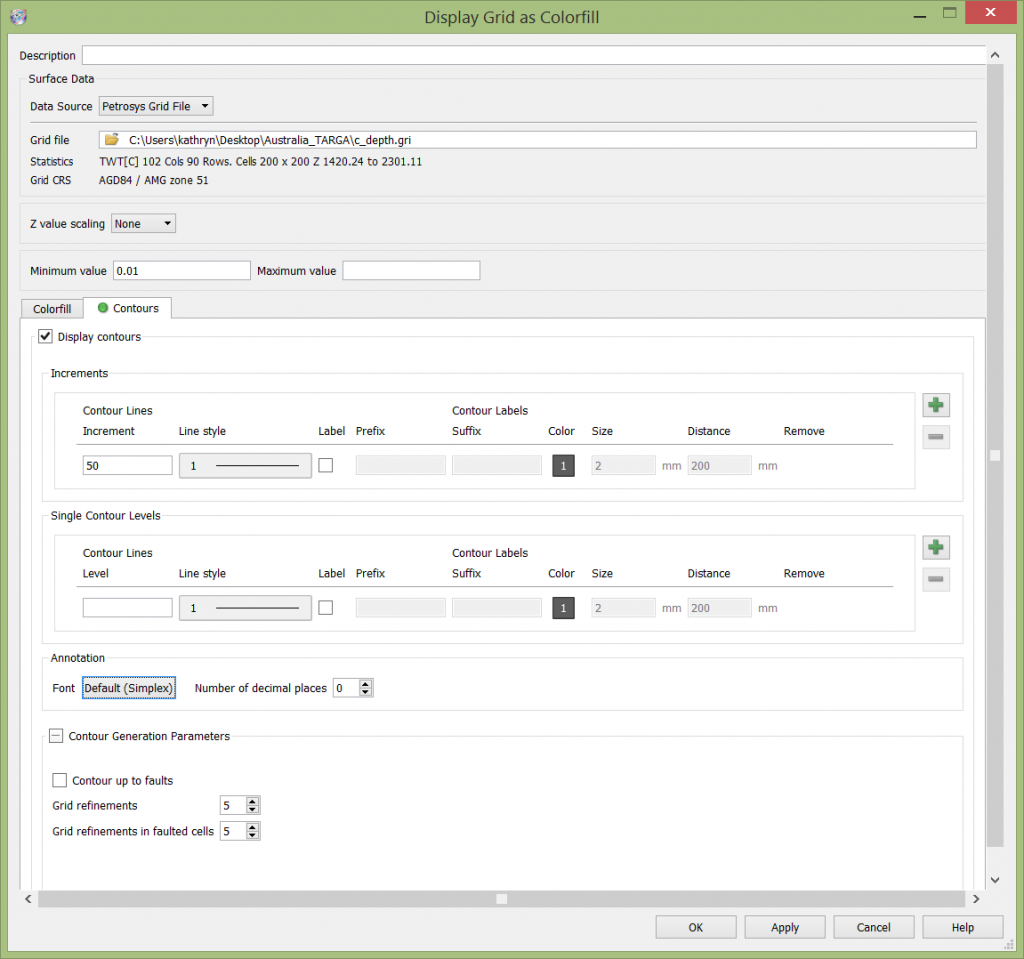
In version 17.7, we added a new feature to display contours from a grid file on-the-fly, accessed directly from the Mapping module. It allows you to interactively display your contours without having to create a contour file first. Start by displaying a grid in Mapping (you may notice the module has changed a little bit) as usual, and then using the new Contours tab to create and display contours on-the-fly.
So now there are 2 ways to create and/or display contours in Petrosys – through Surface Modeling and interactively through the Mapping module. Both modules allow you to specify min/max, contour interval and additional contours if needed.
If you have any more questions about contours, or any other functionality in Petrosys, feel free to contact your local support team or emailing support@petrosys.com.au.