

Displaying And Gridding Excel-Based Data In Petrosys
With a lot of data used by the oil and gas industry being stored in Excel spreadsheets, users need a way to be able to display and grid the data appropriately. Petrosys has just the...
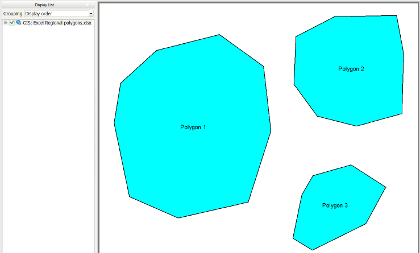
With a lot of data used by the oil and gas industry being stored in Excel spreadsheets, users need a way to be able to display and grid the data appropriately. Petrosys has just the...
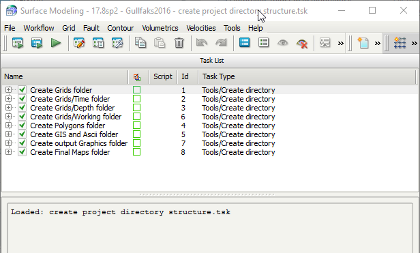
Petrosys mapping uses projects to collect control files, local data collections, surface interpretations and output files related to elements of an organisation's activities...
Your opinion counts! Petrosys is committed to customer satisfaction and would like to know how well we're doing. Your thoughts [...]

Welcome to MAPPING GURU, the newsletter that contains the latest news and information from Petrosys. Read Newsletter In [...]
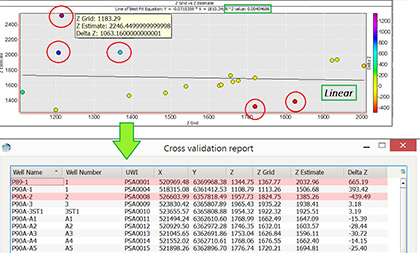
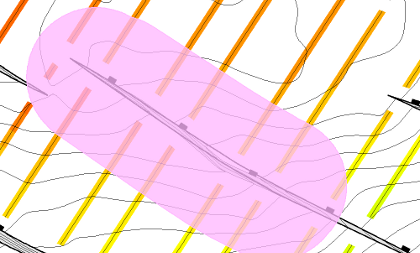
Cross validation is a technique that helps to evaluate generated grids by examining the impact that individual data points have [...]
The Petrosys subsurface mapping editors are vital tools for many geoscientists globally. Their flexibility and simplicity generates a powerful suite [...]
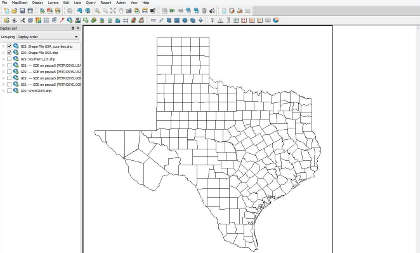
I have a shapefile of counties of the southeast United States and I would like to only display the counties [...]
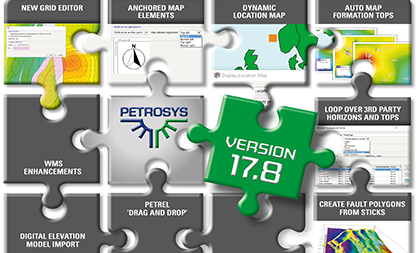
The full production version of the 17.8 stream – 17.8sp1 – was released on 15th September 2016 and focuses on [...]