

With a lot of data used by the oil and gas industry being stored in Excel spreadsheets, users need a way to be able to display and grid the data appropriately. Petrosys has just the tools you need!
The following workflows highlight the steps required in order to include Excel data in Mapping and Surface Modeling processes. These processes allow for the use of multi-sheet Excel files, with the required sheet being selected during formatting. It is presumed that the spreadsheet used will contain relevant coordinate information in order for the data to be displayed/gridded correctly.
Displaying Data
When Excel data is displayed on the map, it is referred to as GIS data. The data can be point, line or polygon in shape and although Petrosys will do its best to identify the shape type when reading the data, this can be changed if necessary. If multiple lines, or polygons are present within the file, there must be an identifiable segment ID, or separator available.
- In the Mapping module select Display > GIS. Under the Feature classes tab select Excel from the GIS data source dropdown menu. Navigate to the required Excel file using the file selector. Alternatively, you can drag and drop the Excel file into Mapping.
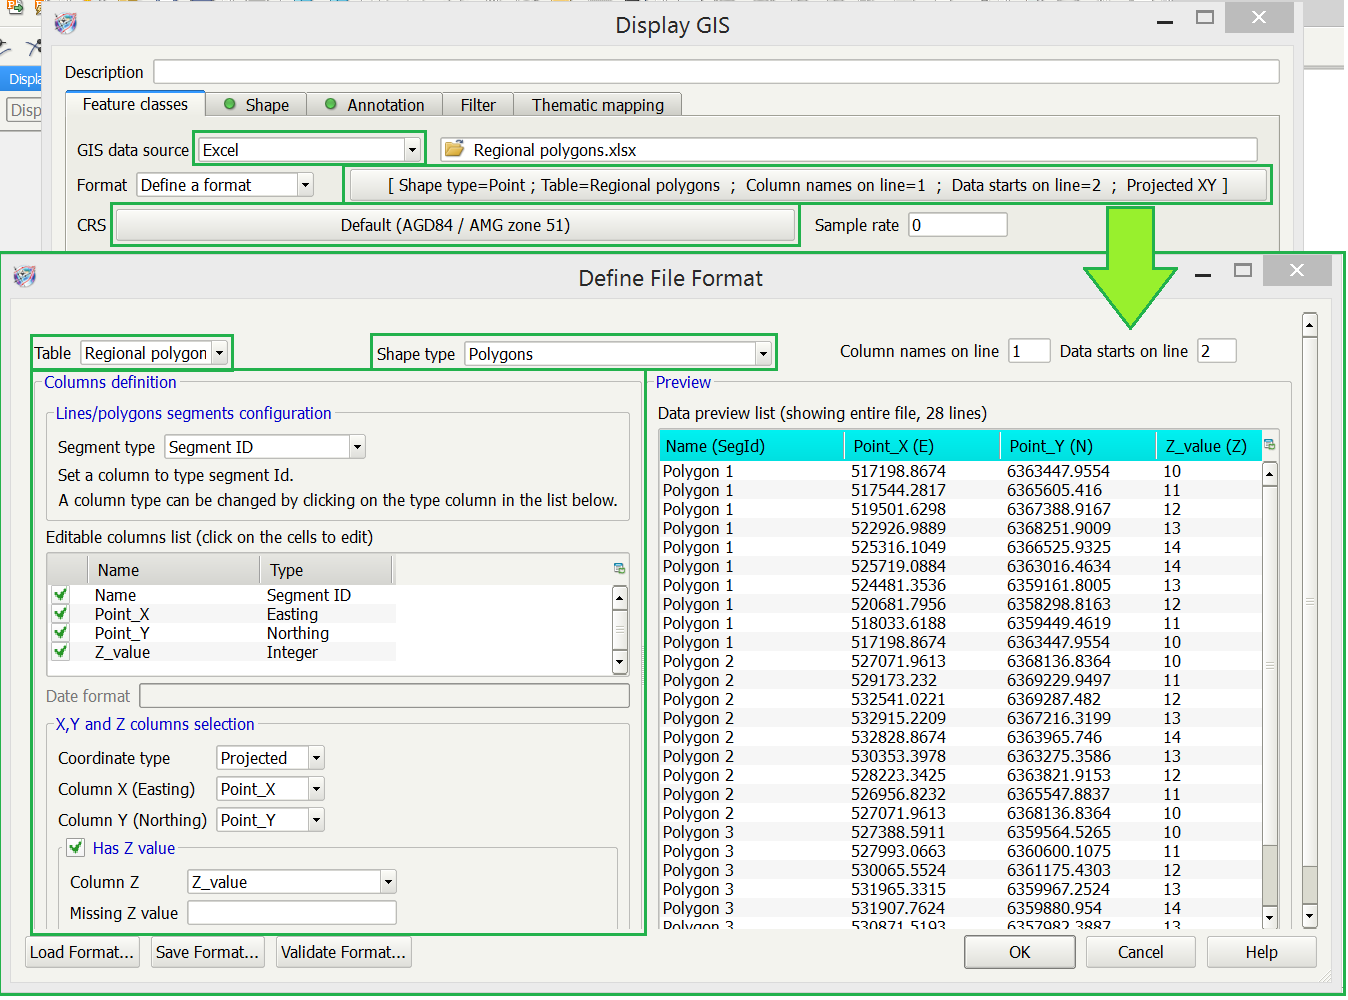
- Petrosys will attempt to define the format of the file. Click on the format selector button to check the format is correct and to make any necessary changes.
- If multiple sheets are available, select the appropriate sheet from the Table dropdown menu.
- Ensure the Shape type is correct, change if required. Remember that lines and polygons require a Segment ID or selector to be identified. This can be done using the Segment type dropdown menu, and then specifying the appropriate column and type under the Editable columns list.
- Under the Editable columns list ensure that the Latitude and Longitude/Easting and Northing columns have been set to the correct type. The type can be changed by clicking on the entry in the Type column and selecting the appropriate option from the dropdown menu. All other required entries, such as Segment ID/Segment separator columns, should be checked also. Entries can be removed from the display process by unticking the associated entry tick-box in the Table.
- In order to display the data on the map, the X and Y columns must be determined. Petrosys will attempt to establish this and also the Coordinate type, but these can be changed.
- If desired, a Z value column can be specified.
- When happy with the format, clicking OK will take you back to the Display panel.
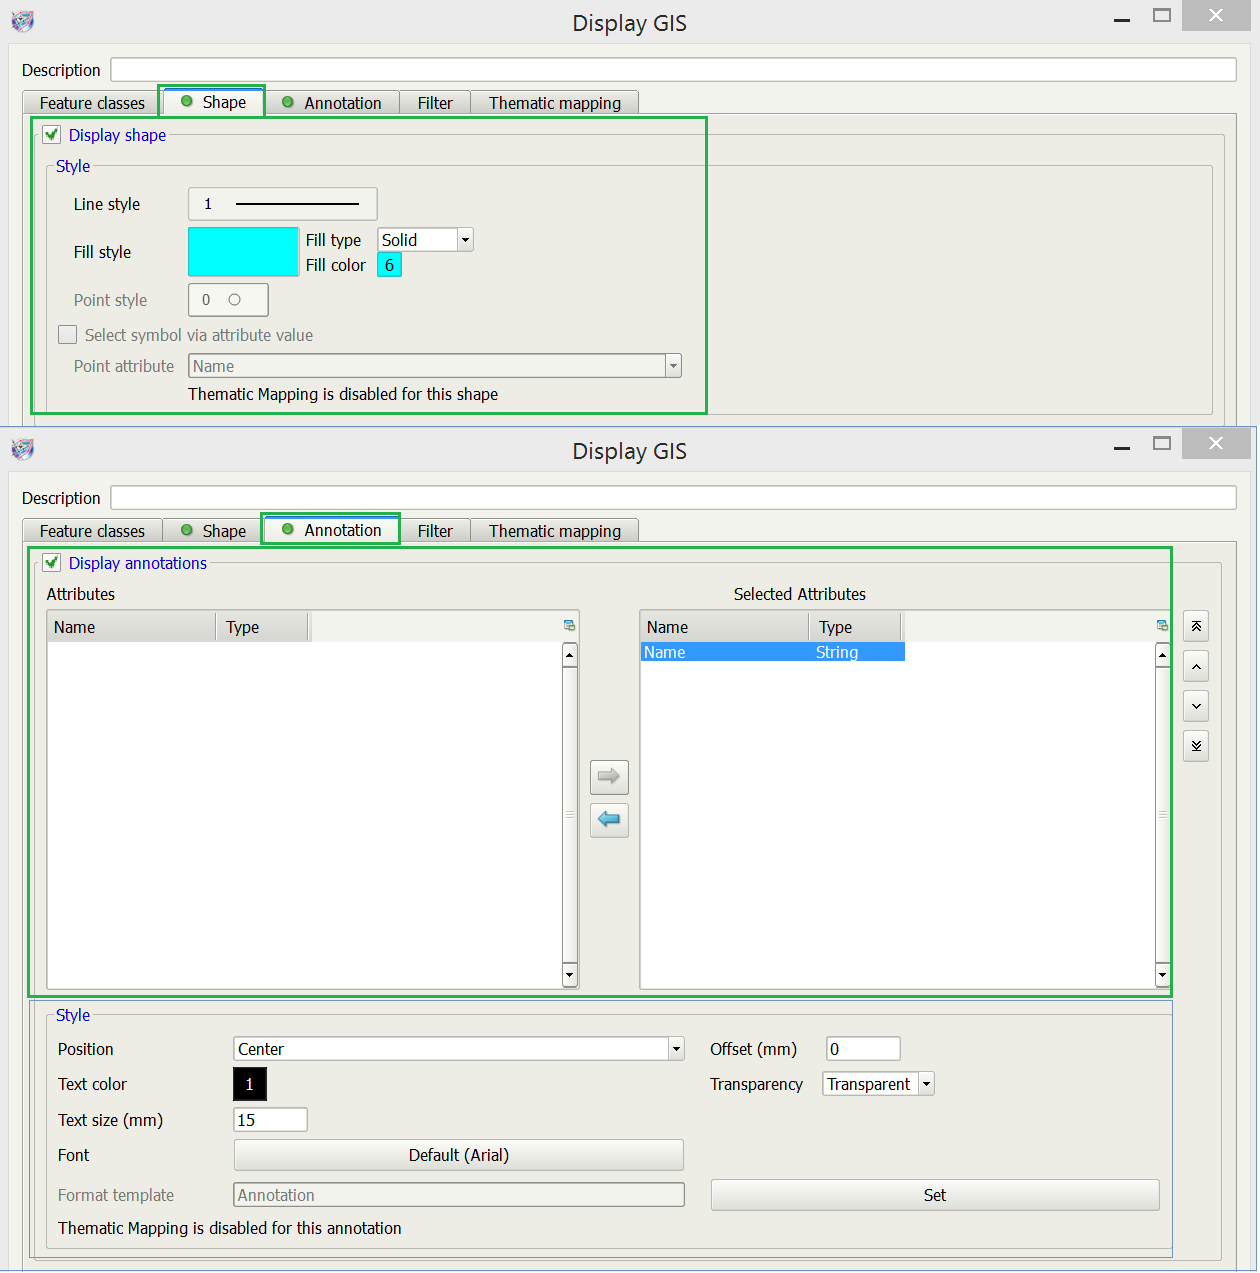
- Under the Shape panel change the line and fill styles as required, for point data there is also the option to specify a point style.
- Include any annotations using the Annotations tab. Select the required attribute in the Attributes column and click the blue right-pointing arrow to move it to the Selected Attributes column. Change the style parameters to suit.
- Thematic mapping can also be applied to Excel data. This is turned on under the Thematic Mapping tab by ticking Enable thematic and selecting the required style from the dropdown menu.
- The available options are determined by the selected style. Enable Shape or Annotation, select the required Attribute and click Scan to detect the values and assign the colour palette.
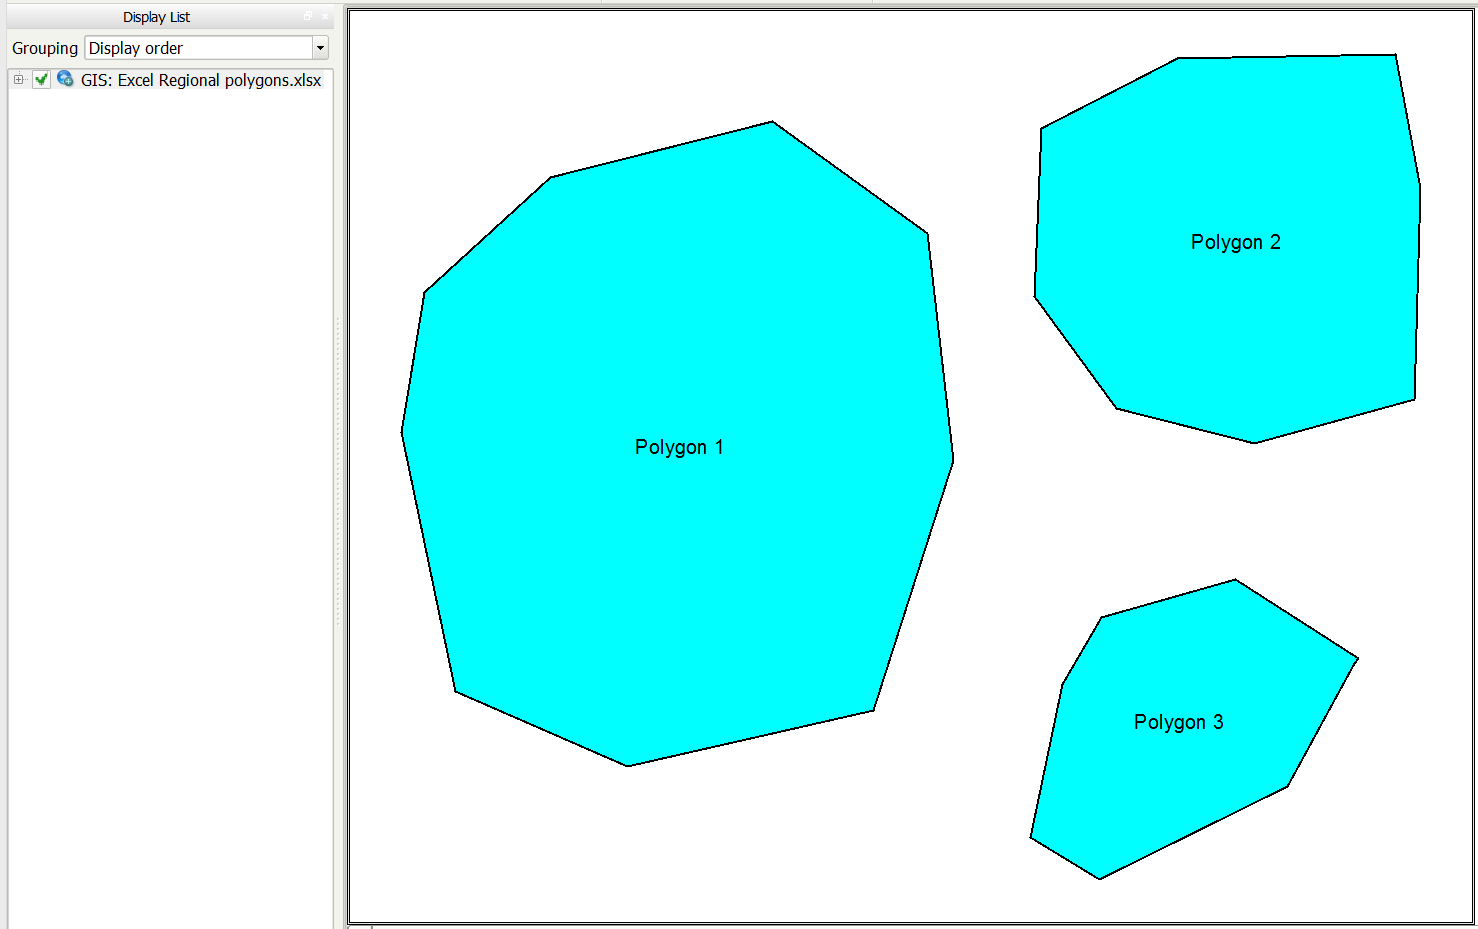
- Click OK to display the Excel data on the map.
Gridding Data
When using Excel data for gridding Petrosys will read the shape type as Point unless otherwise specified using the Shape type dropdown menu when defining the file format. As with displaying Excel data, Petrosys will do its best to identify the format when the shape type is selected, but this can be edited if necessary. If multiple lines or polygons are present within the file there must be an identifiable segment ID or separator available.
- In the Surface Modeling module select Grid > Create Grid.
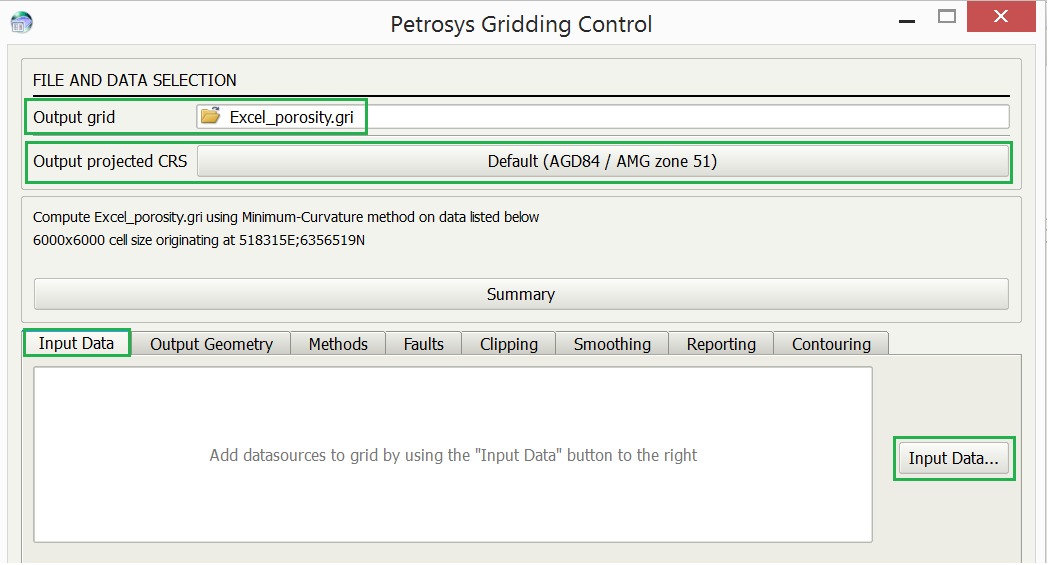
- Specify the Output grid name and save location, if different from the project directory.
- Specify the Output projected CRS for the grid, if different from the project default.
- In the Input Data tab click on the Input Data button.
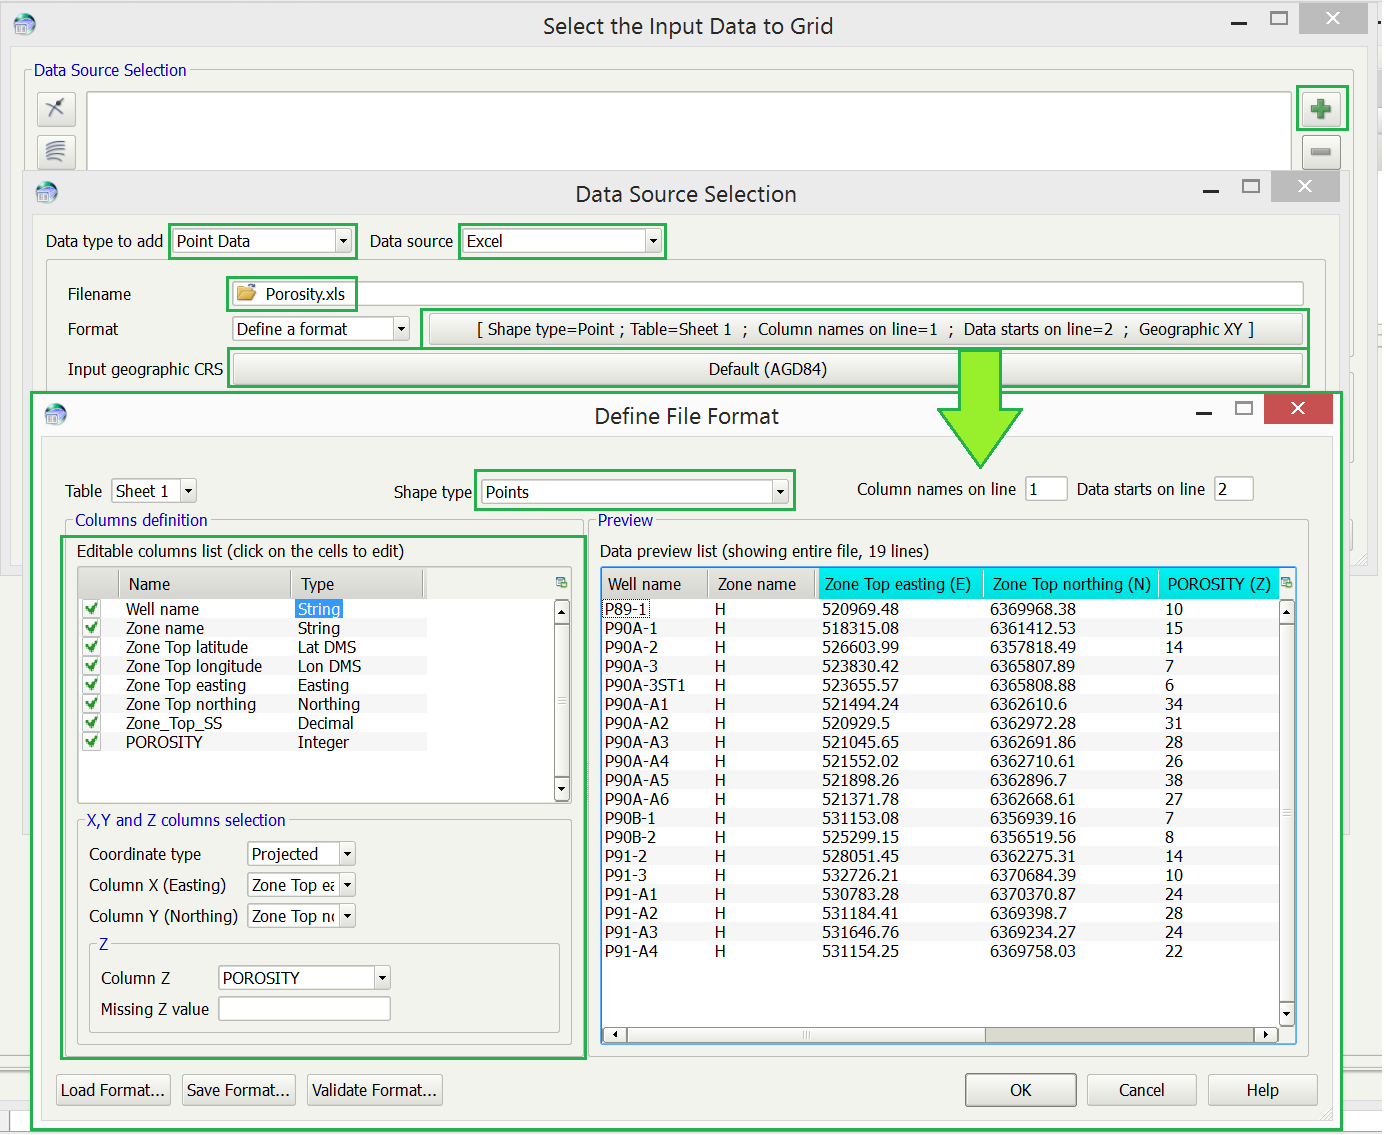
- In the Select the Input Data to Grid window click on the green + button.
- Select Point Data from the Data type to add dropdown menu and Excel from the Data Source dropdown menu.
- Navigate to the required Excel file using the Filename selector.
- Petrosys will attempt to define the format of the file. Click on the format selector button to check the format is correct and to make any necessary changes.
- If multiple sheets are available, select the appropriate sheet from the Table dropdown menu.
- Ensure the Shape type is correct – change if required. Remember that lines and polygons require a Segment ID or selector to be identified. This can be done using the Segment type dropdown menu, and then specifying the appropriate column and type under the Editable columns list.
- Under the Editable columns list ensure that the Latitude and Longitude/Easting and Northing columns have been set to the correct type. The type can be changed by clicking on the entry in the Type column and selecting the appropriate option from the dropdown menu. All other required entries, such as Segment ID/Segment separator columns, should be checked also.
- In order to grid the data correctly, the X and Y columns must be determined. Petrosys will attempt to establish this and also the Coordinate type, but these can be changed.
- In gridding, a Z value column must be specified.
- When happy with the format, clicking OK will return back to the Select the Input Data to Grid panel. If you are only adding one data input source click OK again, otherwise repeat steps 5-13.
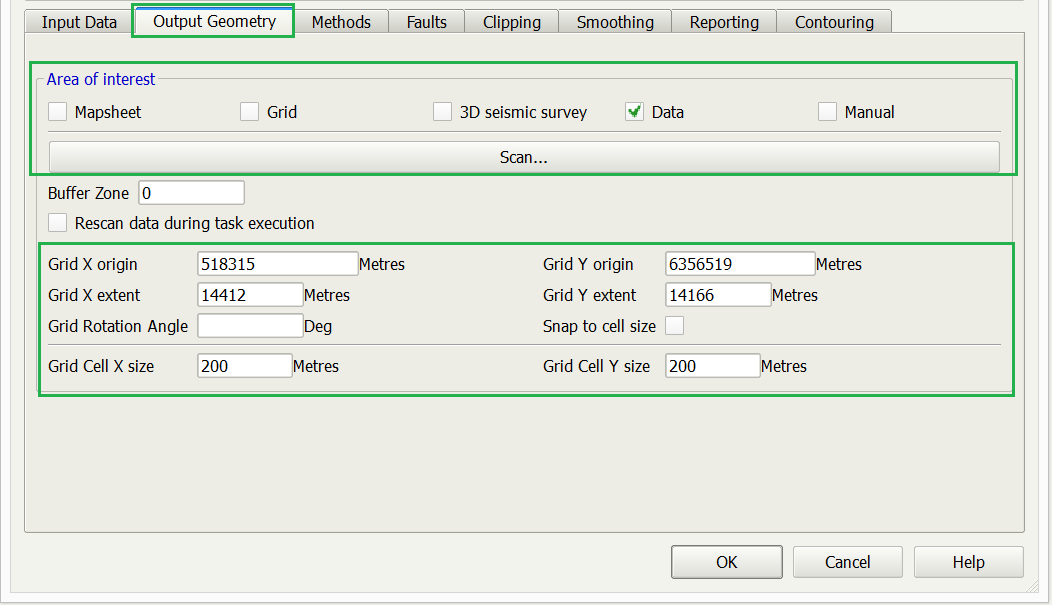
- Under the Output Geometry tab define the Area of Interest (AOI) to be used in order to define the extent of the output grid. If the desired extent is unknown selecting Data will grid the full extent of available data. If the extent is to be restricted to a known entity, such as an existing Grid or Mapsheet, select the appropriate option and specify the required file/Mapsheet.
- Ensure that the Grid X origin, Grid Y origin, Grid X extent and Grid Y extent values are populated. If they are not, try using a different AOI option.
- Specify the Grid Cell X and Y size. For point data a cell size between ⅓ and ⅔ of the average point spacing would be suitable. For line data a cell size between ⅕ and ½ of the average line spacing would be suitable. Displaying the data on the map before gridding will aid in establishing the spacing.
- Change the gridding Operation, Algorithm and Interpolation method under the Methods tab, if required.
- To include faults in the gridding process, toggle on Use fault data under the Faults tab and select the appropriate fault type and file/data source.
- The clip the grid, toggle on Clip grid under the Clipping tab.
- To include smoothing during or after the gridding process toggle on Use smoothing under the Smoothing tab and select the required options including number of passes and filter type.
- To generate reports for the grid, including Cross validation, toggle on Use reporting under the Reporting tab and select the required options.
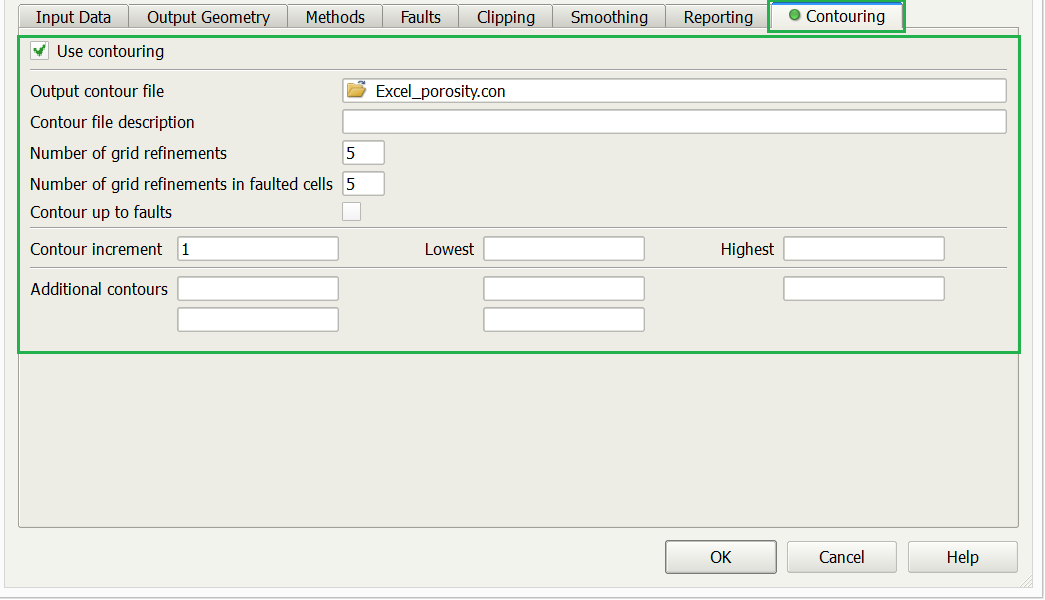
- To generate corresponding contours for the grid (saved to a Petrosys contour file) toggle on Use contouring under the Contouring tab. By default, the contour file will have the same name as the output grid, but this can be edited. Specify the number of grid refinements (5 is the default and falls within the recommended range of 4-7 for spatial data). If using faults in the gridding process, using a high grid refinement for faulted cells (e.g. 10) will result in better contouring near the faults. If no contour increment is specified every contour will be generated. To create specific contour levels, eg. OWC, enter the required values under Additional contours.
- Click OK to run the gridding process.
The above steps provide both the ability to display and grid data from Excel spreadsheets, and to do it well. However, if you need help or require further information regarding the process, please contact your local Petrosys office or email support at support@petrosys.com.au.