We’re getting ready for the release of the up-coming dbMap/Web 2019.1 – here is a sneak preview of a couple of some of the new features you can expect.
Well Log Viewer
A new integrated well log viewer will be added to dbMap/Web providing a quick and easy method to interactively view the well log curves within catalogued LAS and DLIS files.
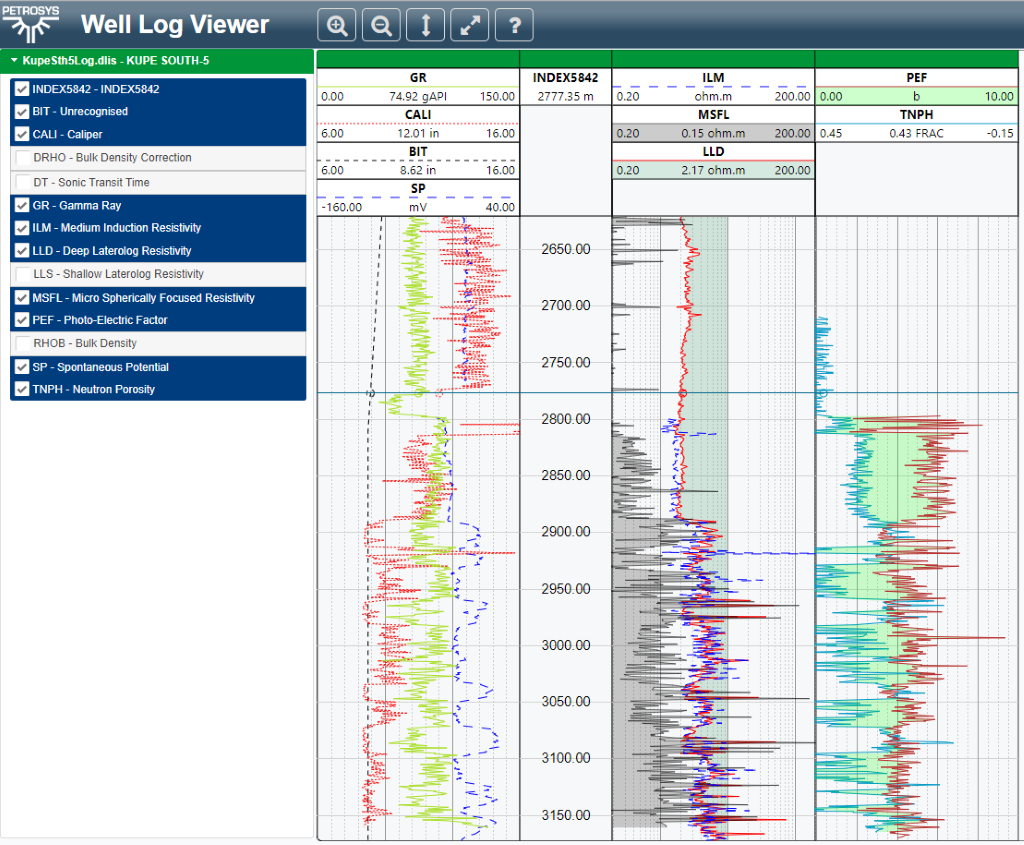
The new well log viewer will provide the following features:
- Support for catalogued LAS and DLIS files.
- Interactive display of multiple tracks.
- Interactive display of multiple curves per track.
- Linear and logarithmic track value scales.
- Modify curve line style (color, style, width, opacity).
- Modify curve left and right fill styles (color, opacity, fixed limit, fill between curves).
- Modify major and minor graticule display styles (color, style, width, opacity, frequency).
- Modify curve display range (left and right values).
- Interactively re-order tracks and curves using drag and drop.
- Zoom, pan and cursor tracking.
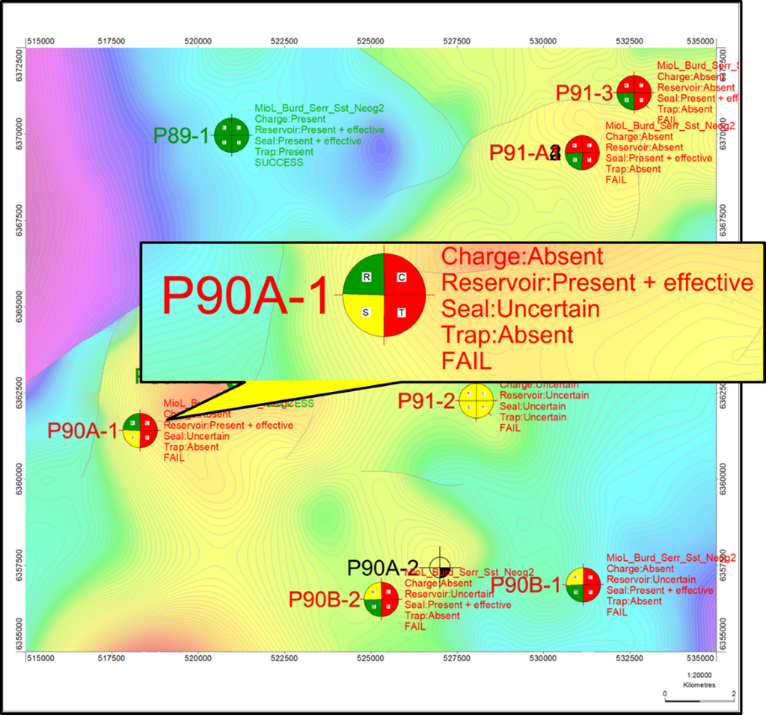
Well Failure Analysis
A new module to conduct ‘Well Failure Analysis’ is being developed. This module will allow companies to analyse data from existing wells to determine where plays have been successful and unsuccessful. The reasons for the failure in the unsuccessful plays can be queried and mapped, allowing better decisions or research to be conducted ahead of future wells.
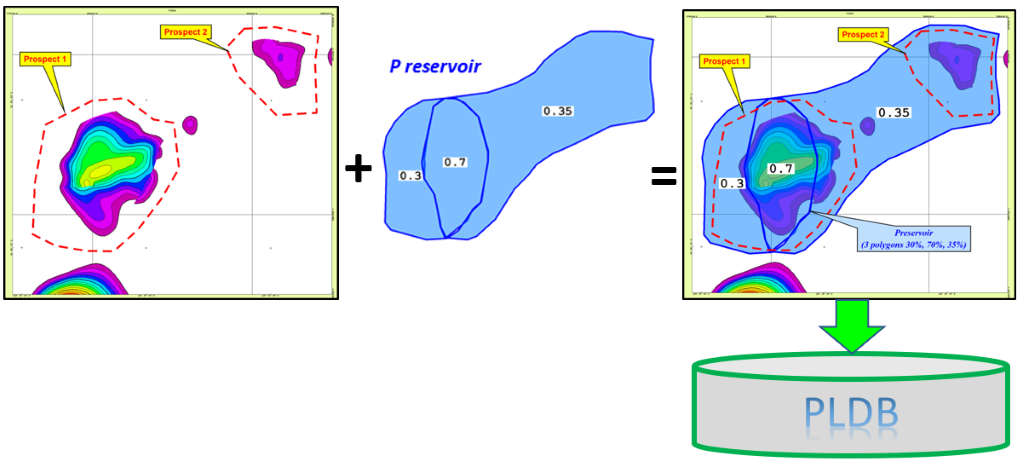
Prospects & Leads
Petrosys Prospects & Leads module will support storing Common Risk Segment (CRS) polygons against play interval chance factors and using spatial comparison with the Prospect or Target polygon to determine the appropriate Play chance factors to use in the resource computation.
The CRS polygons are expected to have an attribute defining the risk for each polygon, and can be loaded into the database using the Petrosys PRO Spatial Data Translator, from data sources such as shape files exported from GIS-PAX Player software.