

Let’s say you’re an exploration portfolio manager. Your role (or at least 1 of them) is to oversee prospects in your portfolio. Those coming into your portfolio, prospects evolving through your portfolio, approving the best ones to be drilled, and reporting a summary of all this information to the Board as and when required.
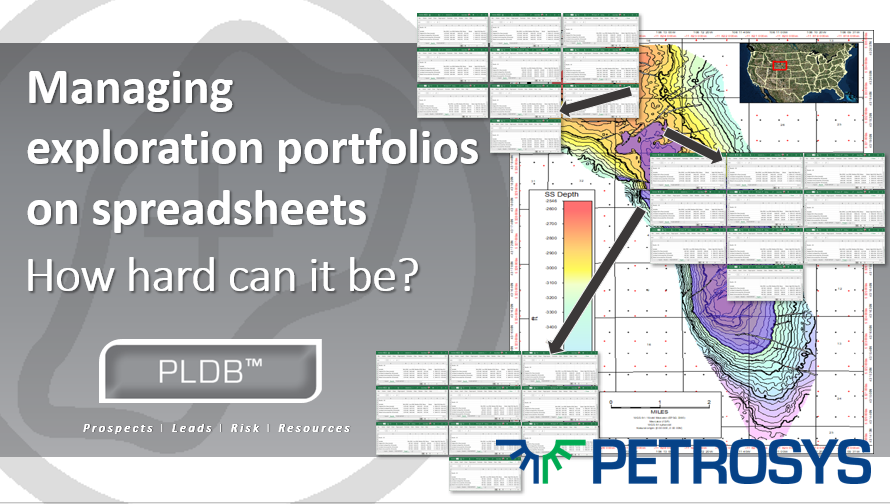
Managing the risked volumes of a single prospect is quite straightforward. An explorationist in your team has identified and mapped a prospect (Figure 1A), they have calculated some deterministic GRV volumes to work out the rough size of the prospect, and then calculated the probabilistic resources by varying unknown parameters such as porosity, hydrocarbon saturation, and chance of success of the play elements etc. (Figure 1B). The output to this process is currently a spreadsheet which is presented to you (Figure 1C).
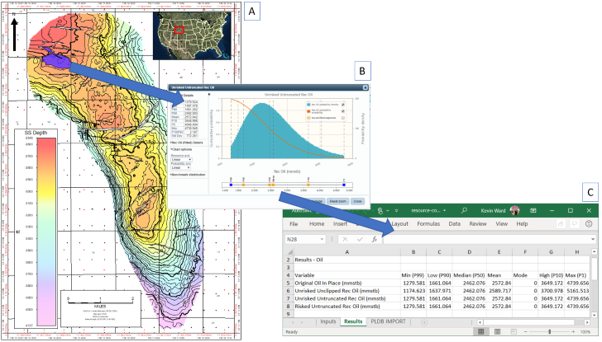
Figure 1: The general workflow for reporting the resources in 1 prospect. A – create a prospect map. B – Calculate the risk and resource volumes using Monte-Carlo. C – present the output on a spreadsheet.
Next Step: More data
Some seismic has just been reprocessed over the area and it’s clear with the better imaging that the closure doesn’t extend as far north as hoped. The probabilistic volumes are run again with a smaller closer but with greater certainty. You now have 2 versions of the spreadsheet to manage. The original (Figure 2A) and the revised volumes (Figure 2B). As the exploration portfolio manager, this change is easy to understand. Your team have shown you the original volumes, the new volumes from the reprocessed seismic and explained what has happened.
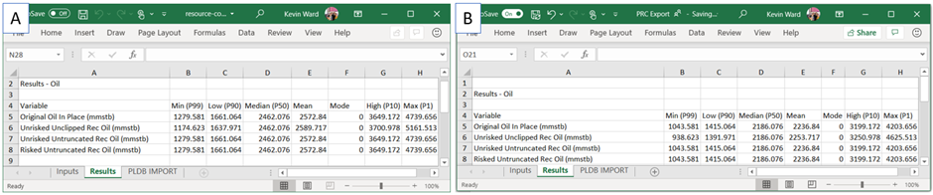
Figure 2: 2 spreadsheets now to manage. A – The original resource output. B – The revised resource output
Next Step: Peer Review
You call your team in for a peer review of the prospect and you ask to see the maps and data for this prospect. It’s a detailed and rewarding technical discussion on the prospect. It seems like the team may have missed an opportunity to target a deeper reservoir which has been known to produce in the basin. Good news for the company but bad news for the team – they now must go back and map the deeper target. They return to you with 2 additional spreadsheets for the volumetric calculations: 1 for the deeper target, and 1 for the overall prospect. You now have 4 spreadsheets to manage.
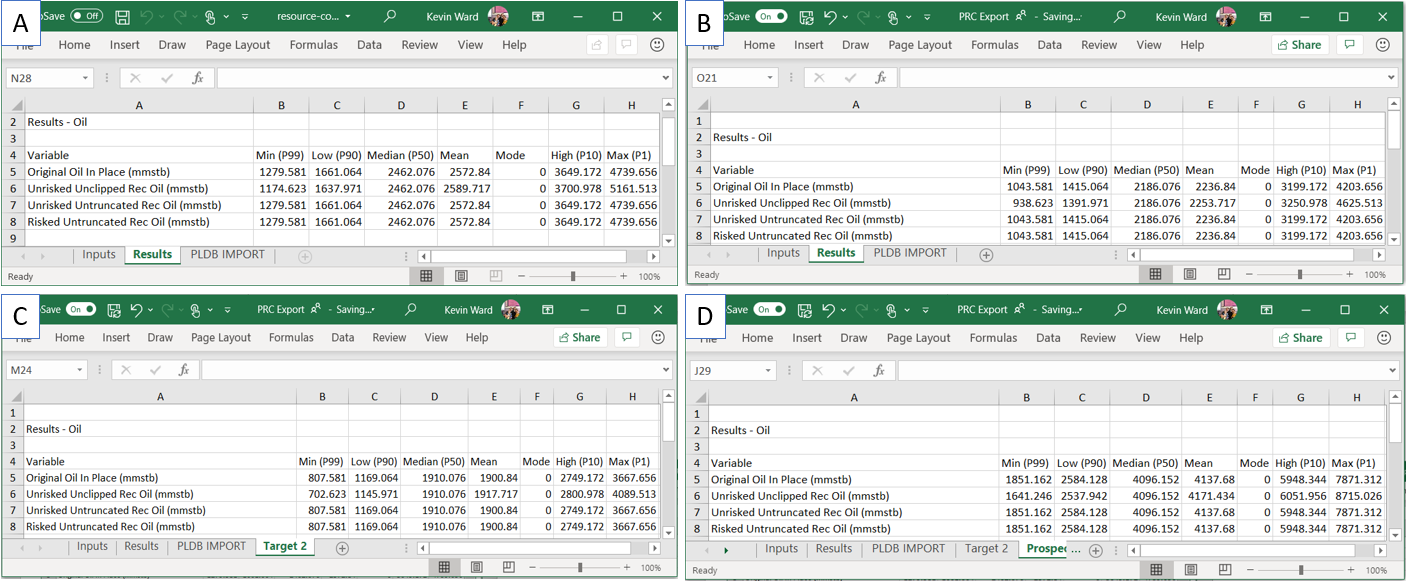
Figure 3: 4 spreadsheets now to manage. A – The original resource output. B – The revised resource output for Target 1. C – The new resource output for (the deeper) Target 2. D – The new resource output for the overall prospect
Next Step: JV partner meeting
A JV partner in an adjacent block has just drilled a well into the same plays as this prospect. It shows that the source rock may actually be a shallower biogenic gas source and not the deeper thermogenic oil you were hoping for. In addition, the primary porosity in both plays has been badly affected by diagenesis and the reservoir quality is not looking great. Your team create yet more spreadsheets. There are 3 new spreadsheets to cover the new information on the porosity of each play. A further 3 spreadsheets are created to model the possible scenario where the hydrocarbon type is pure biogenic gas. Your team presents you with a further 6 spreadsheets. As the exploration portfolio manager, you fear that a mistake has been made and you hope that your team has given you the correct, up-to-date versions of each target/prospect/scenario.
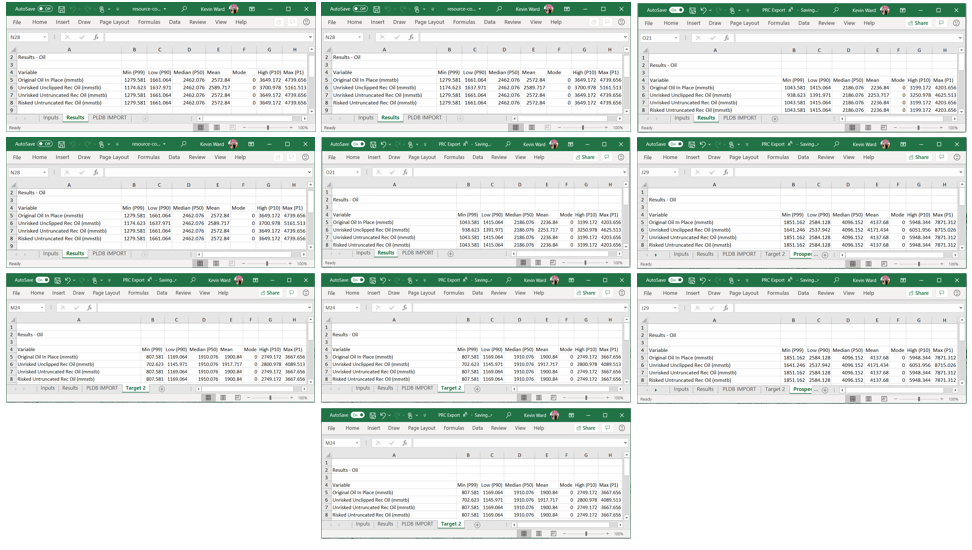
Figure 4: The number of spreadsheets continues to grow as new information and new theories about the prospect evolves
Next Step: Decision Gate
You have another peer review meeting and the prospect has passed the decision gate – it is approved and ready to be added to the portfolio. You ask someone in the portfolio team to update your portfolio spreadsheet with the key numbers and mark the prospect in this year’s portfolio as ‘approved’.
However, this isn’t the only prospect your team have been investigating. There are 4 in this license block so the total number of spreadsheets to handle has quadrupled.
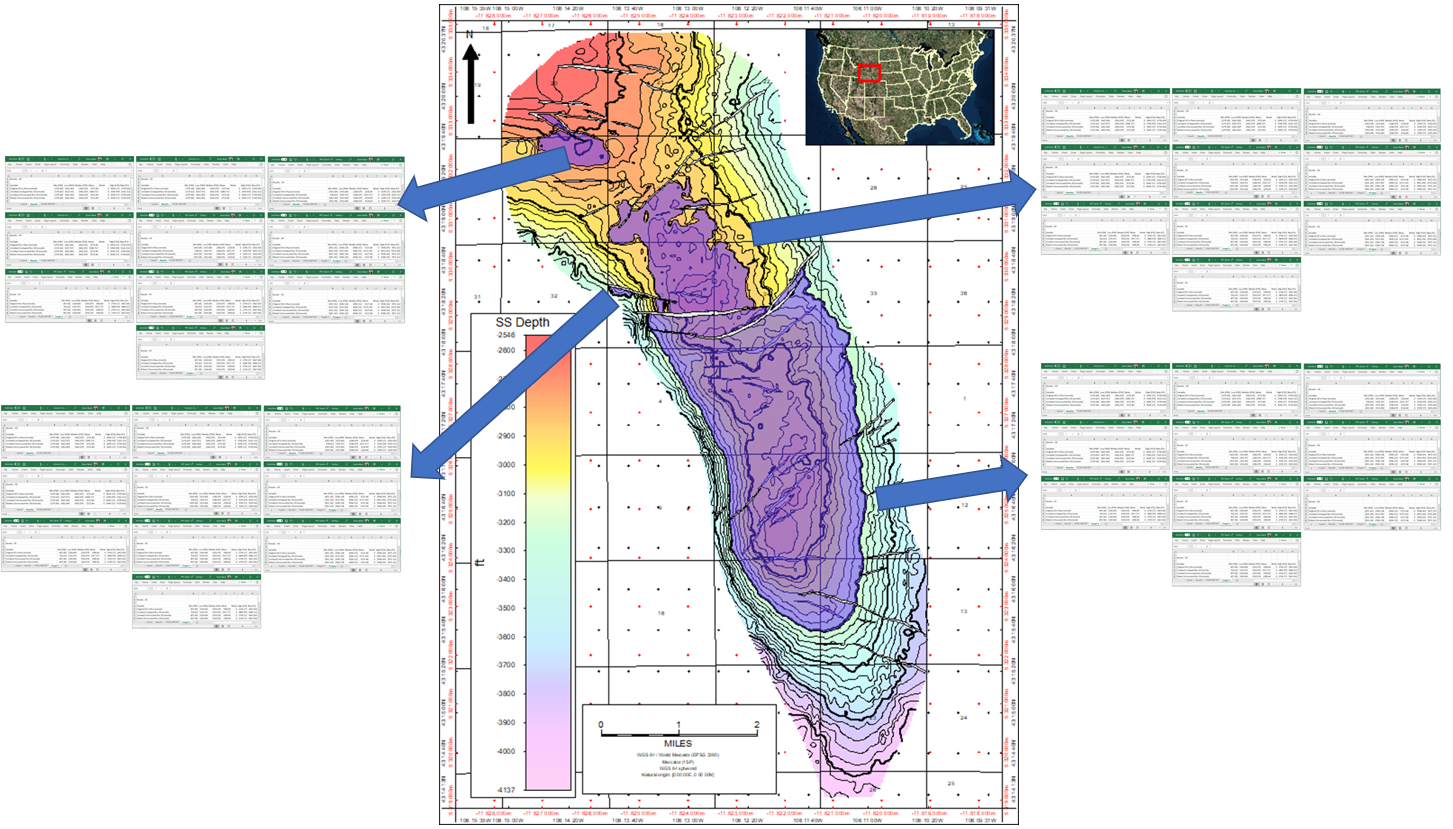
Figure 5: Approximately the same number of spreadsheets have been generated for each of the 4 prospects in this license
To make things harder for you, this isn’t the only team who report to you. Your company is exploring in 3 different areas so the total number of spreadsheets trebles again.

Figure 6: The number of spreadsheets expands as your team work on the 12 prospects in your portfolio.
The Board has asked you to present an overview of the portfolio next week.
You worry that your portfolio is disconnected from any database or geological data sources. The visibility over the entire exploration portfolio is poor and you fear that sooner or later, you will miss some incorrect resource estimation and, therefore, make a poor decision for where to invest your companies limited resources.
Surely there must be a solution to your problems?