
Q. Is it possible to use a formula to add a segment in a bubble map?
A. Yes, it is possible!
When we released Petrosys PRO 2018.3 at the end of last year, we enhanced and added new features to the bubble map functionality. Among these, we now cater for many sources to be used as input data and complex filtering statement is now supported.
Another enhancement is how we deal with formulas when displaying bubble maps. Now when you go into the Bubble Maps or Pie Charts panel [1], you will notice a dedicated section in the middle of the panel to enter equations, as seen in the below screenshot.
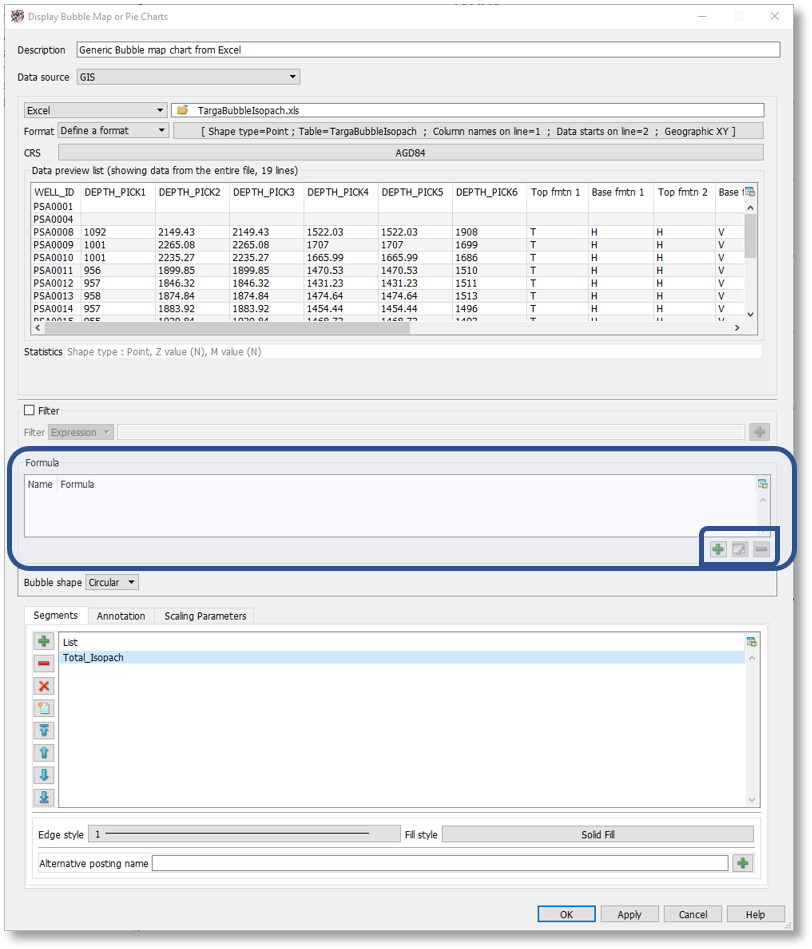
[1] You can access this panel in Mapping from Display > Bubble Map…
To enter a formula, click on the ‘+’ icon in the lower-right of this section and proceed to enter the relevant equation and assign a name. Note that by clicking on the ‘+’ icon of this panel you will have access to all the attributes defined for the input data, which you can use as input to create your formula.
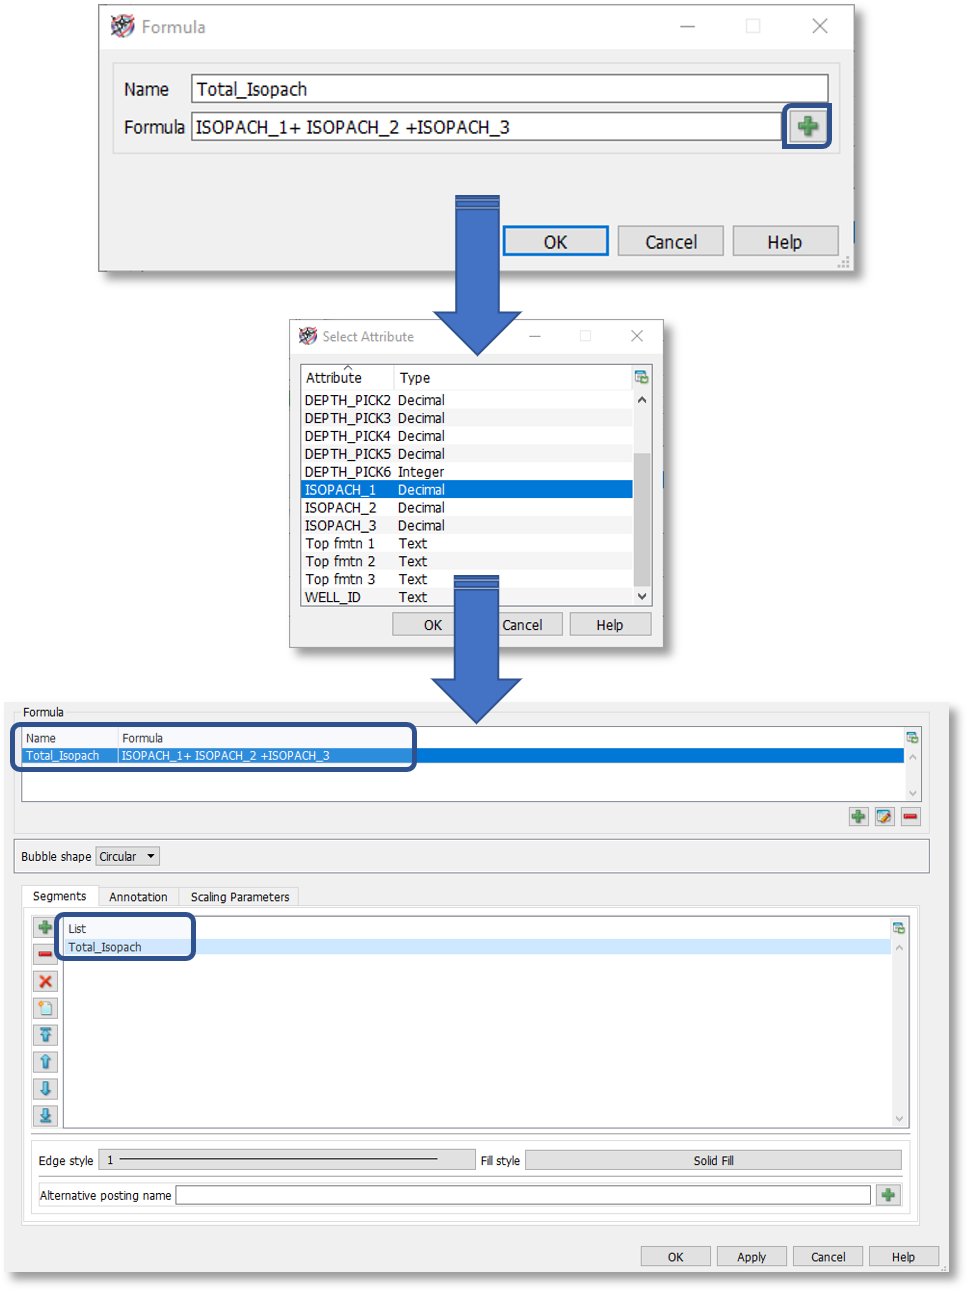
Once you have entered the formula and clicked Ok. The formula will be added to the list and simultaneously as a segment in the lower section of the panel (Segments tab).
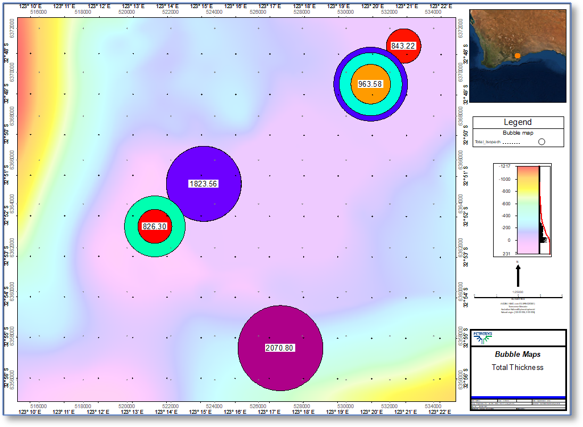
At this stage, all is left to do to display the bubble map is to set the proper annotation and scaling parameters from the relevant tabs. Don’t forget to set the right style for the bubbles.
If additional information is required regarding how to create bubble maps or pie charts, please contact us at support@petrosys.com.au
For more information about the new features in the bubble map tool added in the Petrosys PRO 2018.3 release, check the release notes.