
One of the main workflows used in the oil and gas exploration business today is the creation of depth grids. Petrosys has kept abreast of the methodologies used in this field and has added a new feature in the latest release that allows the user to create a depth grid directly from the wells checkshot survey data.
We can now combine the calculation of the line of best fit for the data from the checkshot surveys and go through to the grid/arithmetic process in the one step.
To kick-off the depth conversion process you may decide to import the checkshot surveys into a Petrosys WDF file, or even read directly from a 3rd party software source like DUG Insight, Petrel or Paradigm.
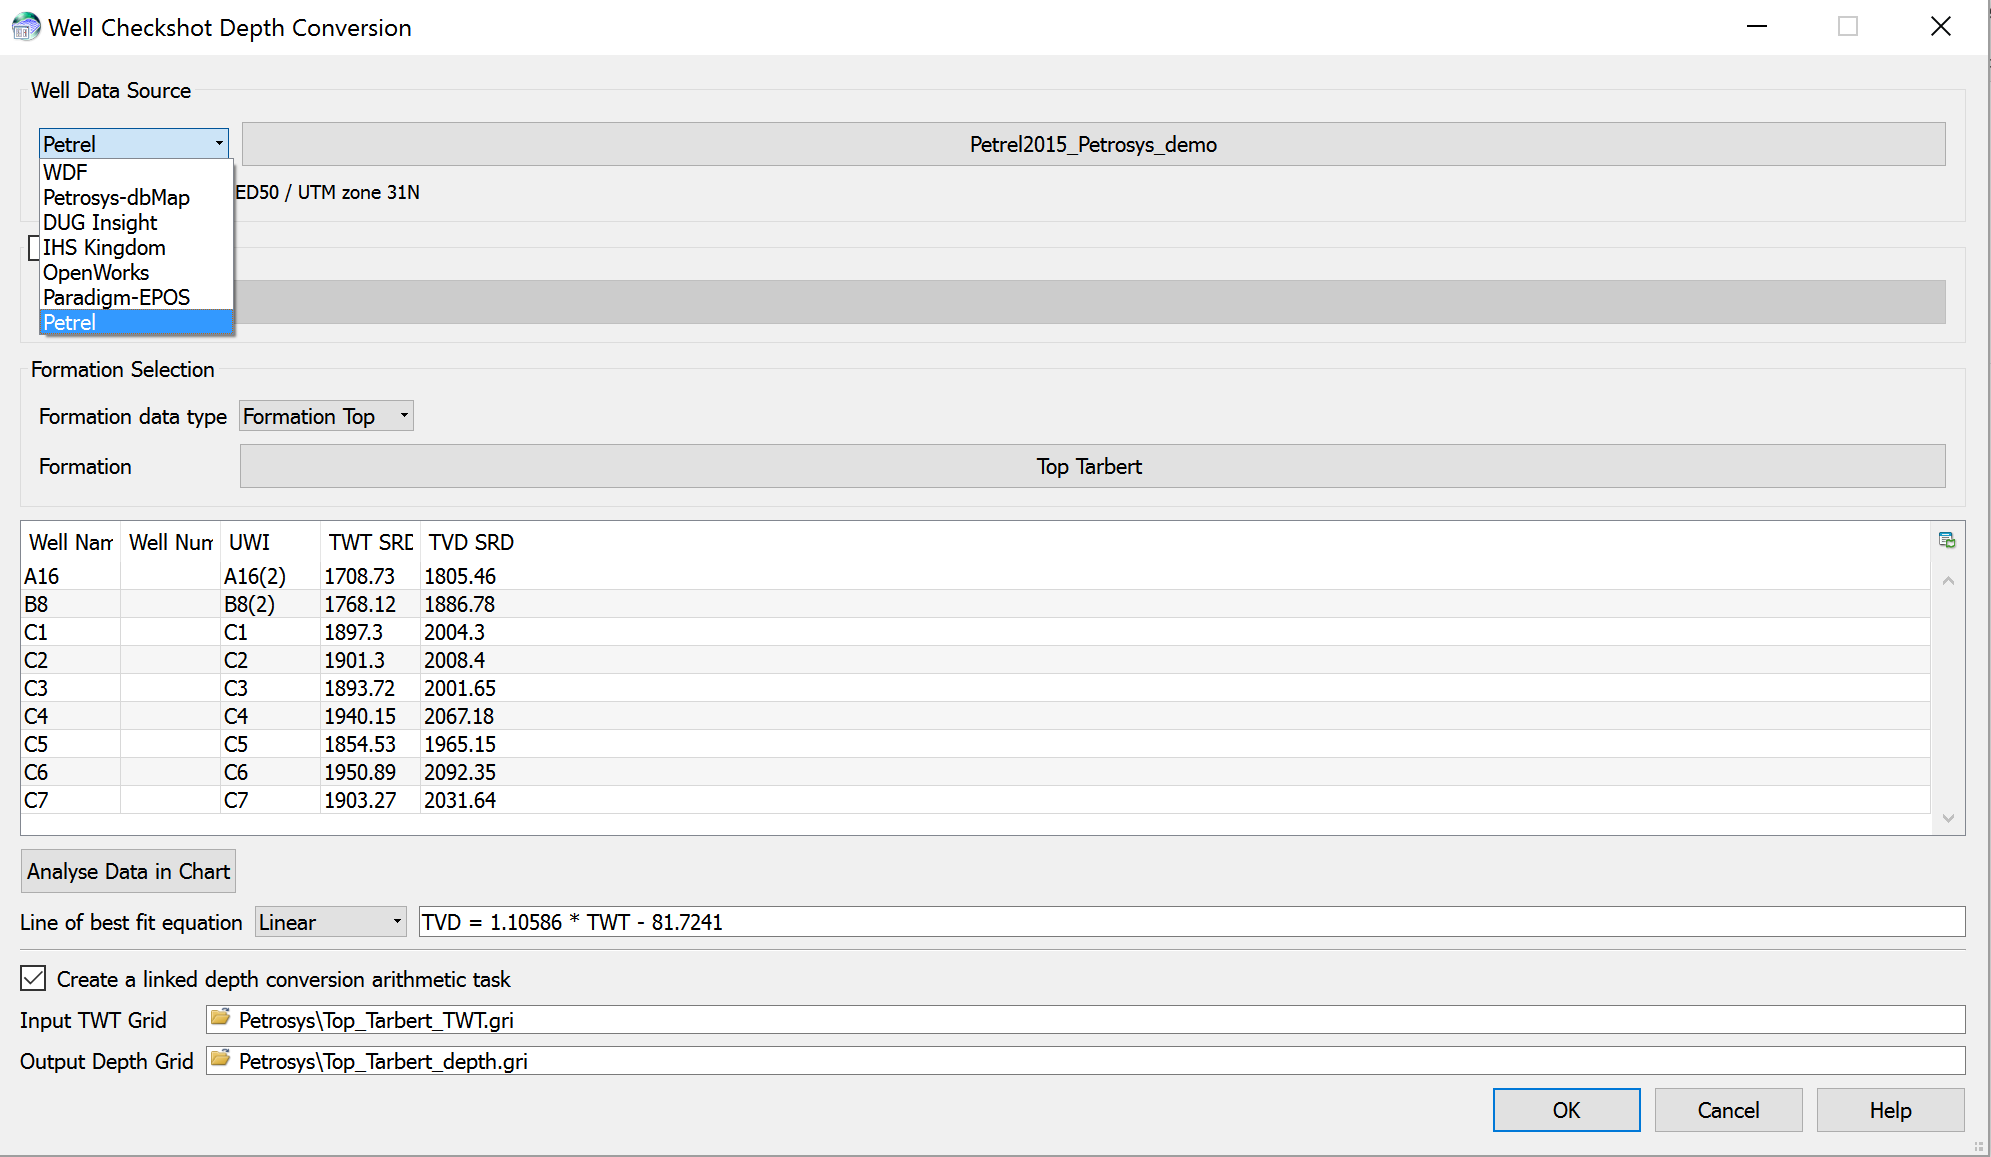
Selection panel showing various 3rd party data sources available.
Once you have selected your data, you can launch the Well Checkshot Depth Conversion… tool from the Velocities menu in Surface Modeling. This will then read all the survey points and will allow you to calculate the best fit equation for the data using the specified function, eg. Linear in this example.
As in any process, some QC is always a must! Petrosys allows you to QC the depth conversion by graphically analysing the data in a chart. In this graph you will be able to detect outliers and eliminate them accordingly. This interactive tool is able to recalculate the best fit equation and RMS automatically, thus providing a better control for the line of best fit and leading to more improved function to be used in the depth conversion process. Once you are satisfied with the results, the function can then be used in the Grid > Processes > Arithmetic... area to calculate your depth grid and the chart, itself, can be exported as a raster image, PDF or can be inserted into a PowerPoint presentation. This can be very handy in order to illustrate to stakeholders the reasoning behind your depth conversion.
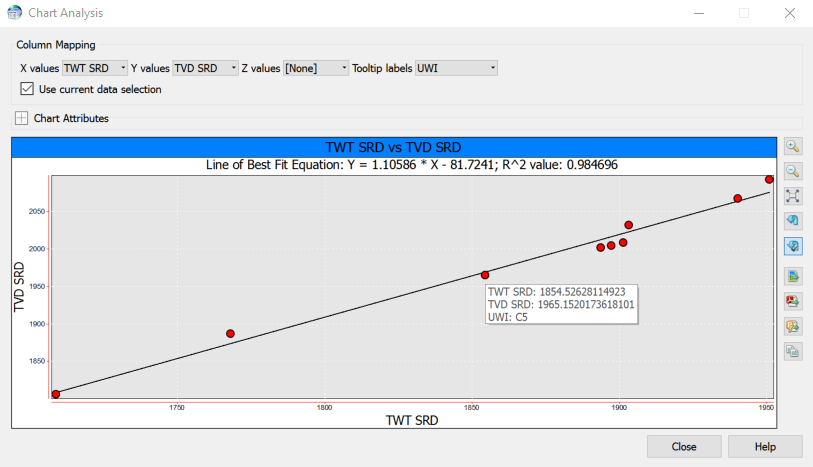
Chart analysis operation showing a linear line of best fit and the computed equation. Here, amongst other things, you can interactively remove outliers and recalculate the line of best fit.
Now you are set to create the depth-converted grid! You only need to enable the link to the arithmetic task at the bottom of the tool and point to your TWT grid. As soon as you hit OK, the Grid Process Arithmetic will automatically open with all the parameters populated and ready to be run.
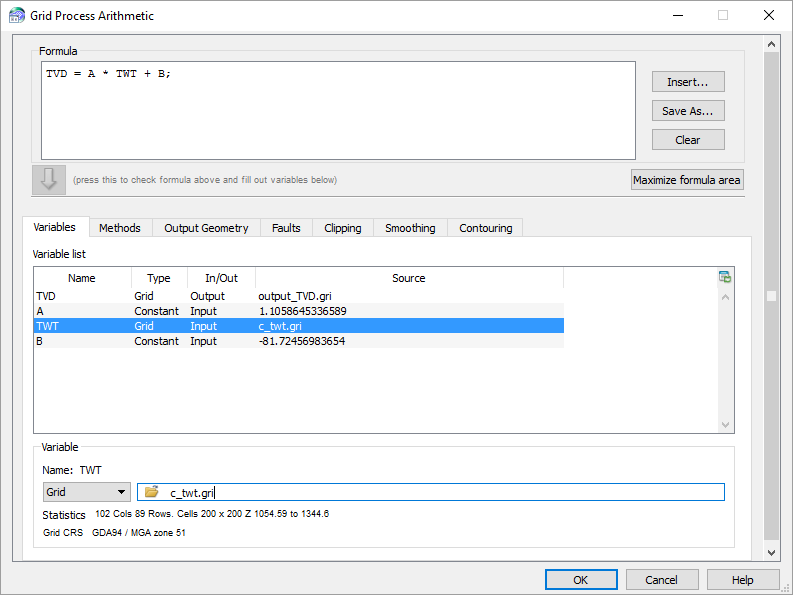
Panel showing the Grid > Processes > Arithmetic… operation where data is updated automatically. This task, along with the checkshot depth conversion, can be saved as part of your workflow in a task file to share with colleagues or rerun at a later time.
Once you have created your depth grid, Petrosys will take you back to the Surface Modeling application. Here you will see the report of what has been done and you can also save the relevant details into a .tsk file. This way you can rerun the same depth conversion at a later time, or even share the workflow with your colleagues. Another great incentive to save this task is to allow the same operation to be run on newly acquired data, so when additional checkshot surveys are added to the 3rd party software the task can be rerun dynamically to update your depth grid. Quite convenient!
Exclusive news: We are introducing new functionality for depth conversion in Petrosys version 17.8 called “Well Time Depth Trend Conversion”. This option is similar to the checkshot depth conversion with the difference being that the input data is a TWT grid and well formation data instead of well formation data and well checkshot data. Stay tuned for more on that!
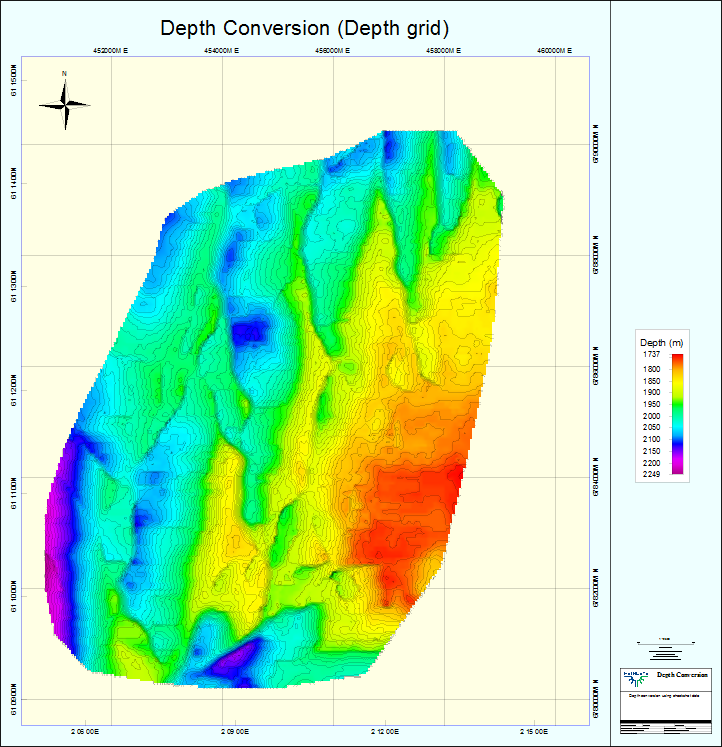
Depth converted grid example.