Petrosys 2019 software releases have been outstanding!
Part of the Petrosys company ethos is to ensure that our clients get the most from their software investment and as such our development team work tirelessly to continue to improve and enhance the Petrosys software suite of tools to put the best possible version of our software in the hands of our users.
2019 has been a particularly busy year for the Petrosys development gurus, with major new functionality being added to Petrosys PRO, dbMap and PLDB. The response from our users has been outstanding – here are some of the highlights.
Petrosys PRO
Petrosys PRO is widely used in production teams globally and after discussing their need with regards to well data, we have concentrated our development on exchanging well log data and have made some major improvements to the display of well data.
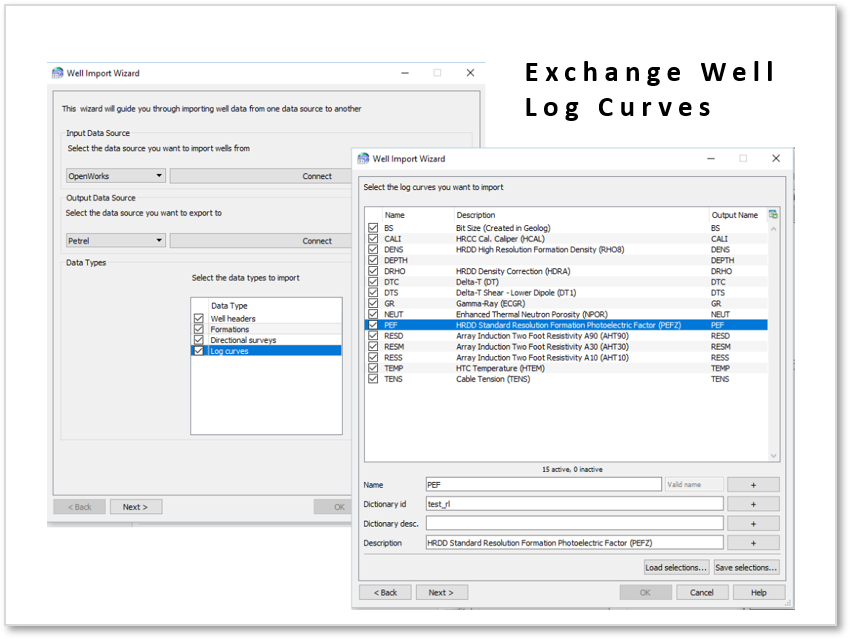
 Well Log Curves/Exchange
The addition of Well Log Curves to our continuously expanding ‘Exchange’ capability will be a popular addition for many PRO users. PRO has long been able to exchange well header, tops, directional surveys and checkshot surveys between a variety of 3rd party sources and the addition of ‘Well Logs’ to this option makes PRO an even more proficient data management tool.
Well Paths
To improve the quality of Production Mapping in PRO, our users have asked us to focus on how deviated well paths are displayed. With advancements in geosteering, modern wells may penetrate the top or base of a key reservoir zone repeatedly. In PRO 2019.1 the user can display the multiple intersections as well as display multiple zones in the same display layer. This ability, combined with PRO’s direct connections to key data sources, will give production teams easily updateable maps showing the spatial distribution of key producing zones.
Log Signature Maps
 Building on the 2019.1 well log exchange & well log viewer functionality Petrosys PRO 2019.2 now supports log signature displays. Users can now connect to their interpretation packages and display a wide variety of well log curves directly in Petrosys PRO mapping. These log signatures can be displayed on the map at well top or bottom hole locations. Use of style templates allows for consistent presentation of curves.
Supported log sources include:
- DUG Insight
- IHS Kingdom
- ODM
- OpenWorks
- Paradigm-EPOS
- Petrel
- DLIS or LAS Files from Petrosys dbMap
In addition to the 3rd party data sources, DLIS or LAS files catalogued through the Records Management (RM) system in the dbMap PPDM38 data model can be read and displayed on the map.
dbMap
 Well Log Viewer
A new integrated well log viewer will be added to dbMap/Web providing a quick and easy method to interactively view the well log curves within catalogued LAS and DLIS files.
The new well log viewer will provide the following features:
- Support for catalogued LAS and DLIS files.
- Interactive display of multiple tracks.
- Interactive display of multiple curves per track.
- Linear and logarithmic track value scales.
- Modify curve line style (color, style, width, opacity).
- Modify curve left and right fill styles (color, opacity, fixed limit, fill between curves).
- Modify major and minor graticule display styles (color, style, width, opacity, frequency).
- Modify curve display range (left and right values).
- Interactively re-order tracks and curves using drag and drop.
- Zoom, pan and cursor tracking.
Well Failure Analysis
Well, Failure Analysis A new module to conduct ‘Well Failure Analysis’ is now available. This module allows companies to analyse data from existing wells to determine where plays have been successful and unsuccessful. The reasons for the failure in the unsuccessful plays can be queried and mapped, allowing better decisions or research to be conducted ahead of future wells.

PLDB
Risk Model Guidance Enhancement
PLDB users will now be able to access the latest addition to the software, Risk Model Guidance. This new module in PLDB provides guidance to geoscientists, via a series of configurable questions, whose answers provide suggested ranges for risk ‘sub-factors’ that are then combined to a final risk value for each risk element, (closure, seal, reservoir and source).
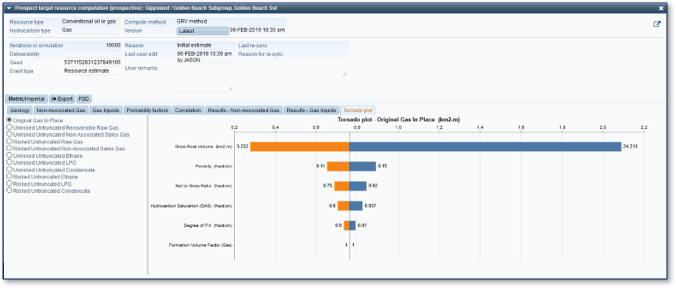
Tornado Plots
Further improving the resource estimation process, Tornado Plots have been added to PLDB. These give an insight as to which of the input parameters has the greatest effect on the final resource estimate.
Get in touch
If you would like to know more about Petrosys Software contact our team of expert Gurus.


