

Welcome to Edition 30 of petrosysguru.com, the newsletter that contains the latest news and information from Petrosys.
In this issue:
Mapping Well Parameters and Tolerances with Display GIS
Version 17.6 allows you to map well parameters and tolerances by posting data in a shapefile or spreadsheet with an orientation attribute using Display GIS.
Dear Steve…
How can I view my grids on a world map?
A New Generation of Reservoir Simulation Technology
Petrosys recently held meetings and workshops introducing tNavigator reservoir simulation technology to Perth.
Introducing Online Training
Petrosys training is going online! Read about the rollout of this exciting new addition to our training program.
Meet With Us…
It’s been a busy year out on the road so far and it’s not over yet! There are still many opportunities to catch up with us… next on the agenda is UrTec in San Antonio, 20-22 July.
An Afternoon In…
In this issue we stop over in Glasgow, the “Friendliest City in the World”, for the afternoon. There’s something for everyone… from old-world relics to modern culture.
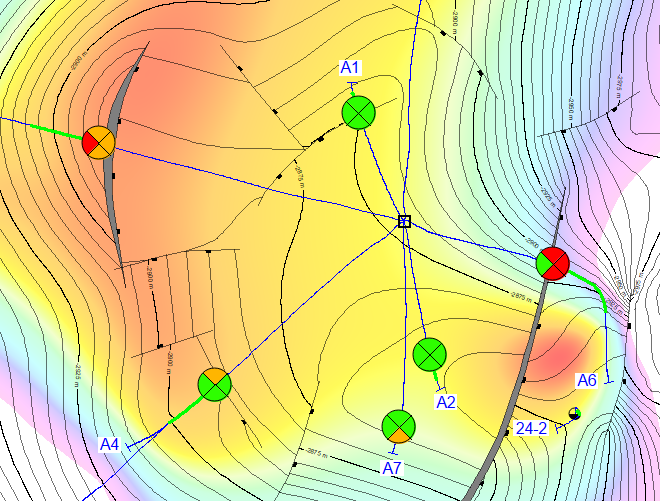
One interesting use of the Display GIS functionality is to display a traffic light system – green “no action”; amber “caution”; red “take action” – for key performance indicators. In this example, 4 KPIs for the producing sand are measured and posted on the map at the sand top location.