Version 17.4.5 sees the introduction of two new pieces of functionality – the display of Esri LYR files and cross validation.
Display of Esri LYR files
Version 17.4.5 also sees the inclusion of Esri LYR files into the display capability of Petrosys mapping, meaning the diversity of content available for creating data rich maps is greater than ever before. Petrosys can automatically display individual ArcMap documents by converting them to an XML based format. Alternatively, ArcMap documents may be converted in bulk using a new conversion tool which is available from the /Tools menu in the Petrosys Launcher. Once converted, an Esri license will no longer be required for displaying files so bulk conversion provides a useful tool for preparing large collections of data for use in Petrosys.
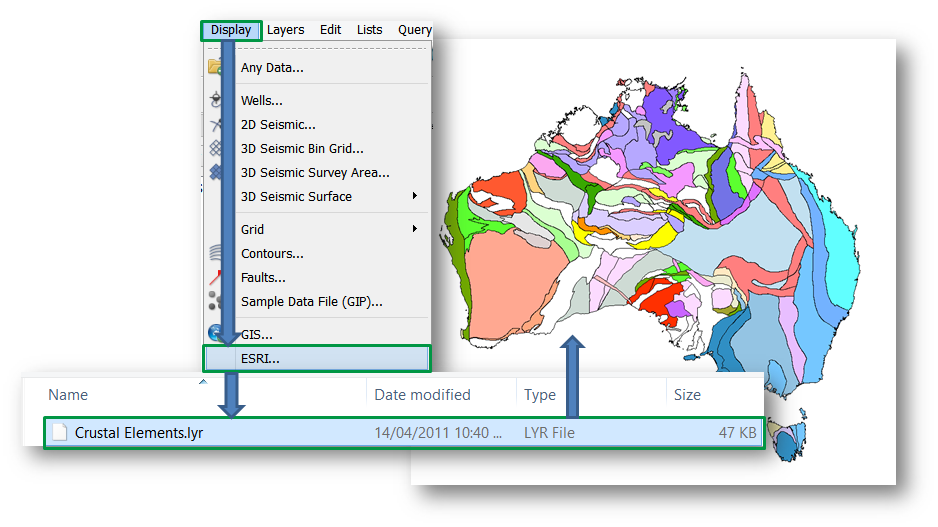 LYR data courtesy of Geoscience Australia.
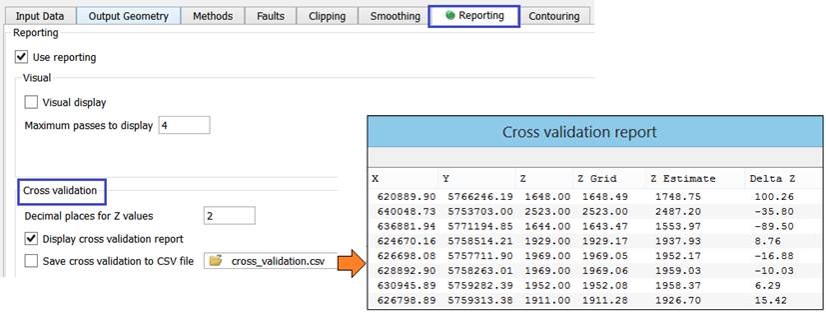
Cross Validation
Cross validation is a method that can help you understand your input gridding data and how accurate your output grid (model) predicts new locations. This is achieved by creating a grid using all data, then removing a single data point and recomputing the grid. The difference between the two grids gives an estimation error. This is then done for all data points and a report is produced. The errors can also be gridded to examine the error spatially. Cross validation is commonly used to:
- Understand how accurately your model (grid) predicts new drilling locations.
- Determine which gridding algorithm/parameters to use – For instance, you might run cross validation using standard gridding and then again using another gridding method such as kriging. You can then compare how well each model predicts new locations and get an idea which gridding method gives you better results.
- Locate ‘outlier’ data points – Outliers can be detected using cross validation by examining the error of one data point against the others. When the error of one point is significantly larger than for the other points, it may indicate that the data point is an outlier (this could be due to an incorrect geological or seismic pick for instance).
Cross validation can be activated from within Surface Modeling, Grid/Create grid, on the Reporting tab. The ‘Delta Z’ values from the output report can also be gridded to give a spatial representation of predictive error.