

There are now two ways in which Petrosys deals with stacking velocities. You can import them to a Petrosys SDF file, or you can now grid them directly. Note that this option is only available if your stacking velocity file has coordinates associated to it.
To grid stacking velocities directly:
- Open the Surface Modeling module
- Select Grid > Create Grid…
- Click on the Input Data… button
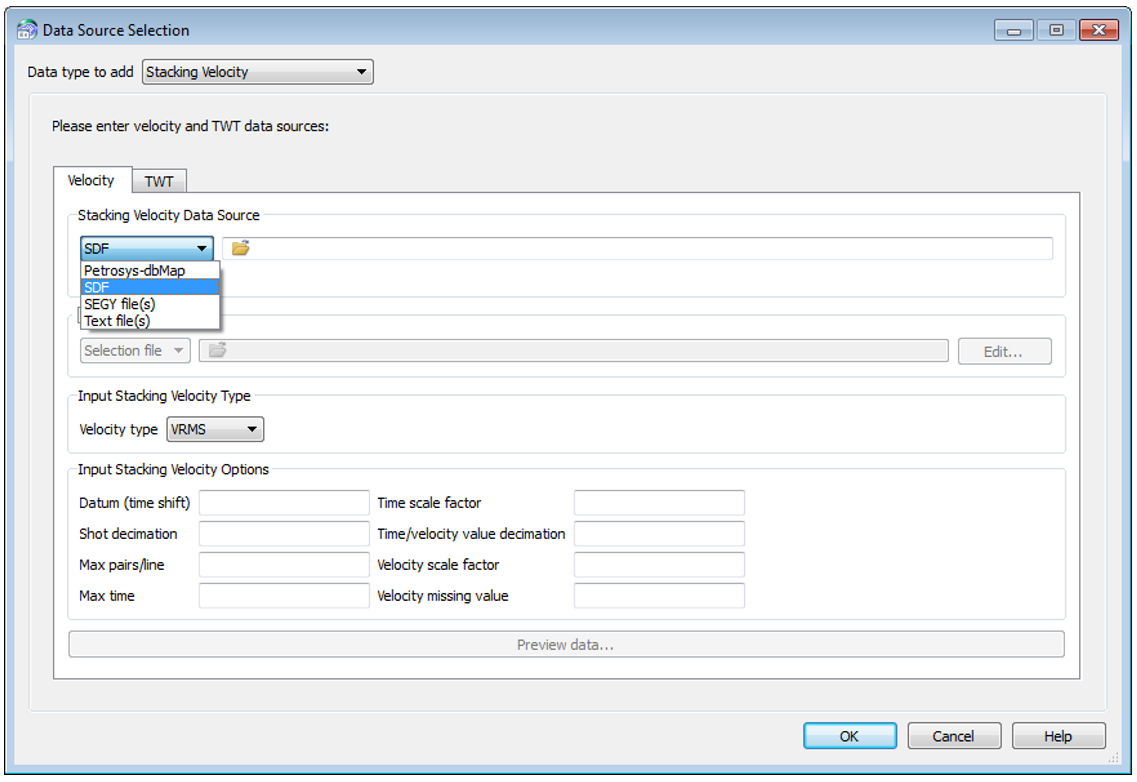
- Then click on the green “+” and add the “Stacking Velocity” data source from the drop down menu
You can select from various sources for your stacking velocities and you can also select multiple sources within the source selection, eg. Multiple SEGY or ASCII files.
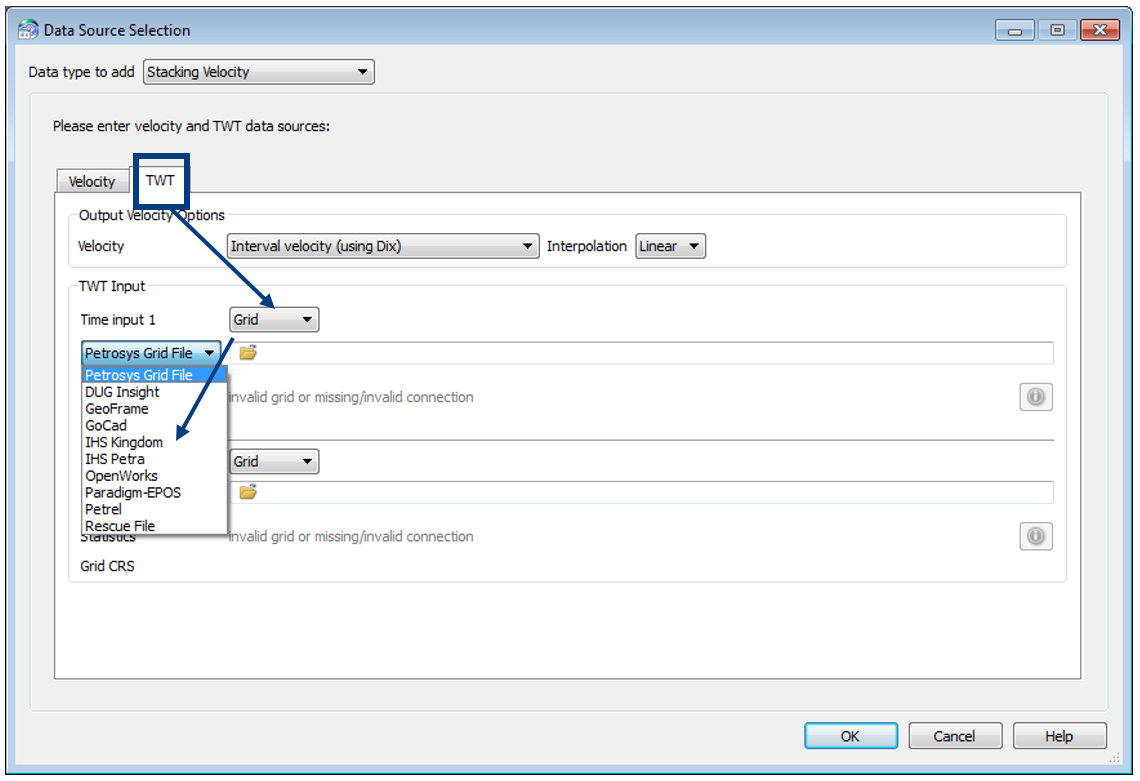
 Having selected “Stacking Velocity” as the input data source, you now need to select the TWT inputs. There are two input types available: grids or a constant TWT. The grid option will allow you to select TWT grids from a number of 3rd party data sources.
To do this, click on the TWT tab and select the output velocity type (interval velocity or average velocity or simply assign the input velocity) and then choose an interpolation method to use. Using a TWT input grid is recommended but a constant time can also be used.
 You can then select any further parameters required in the boxes at the bottom of the panel to decimate the data if needed – this can be of value if you want to get a quick look at what a depth grid might look like, before running a final one with all the data.
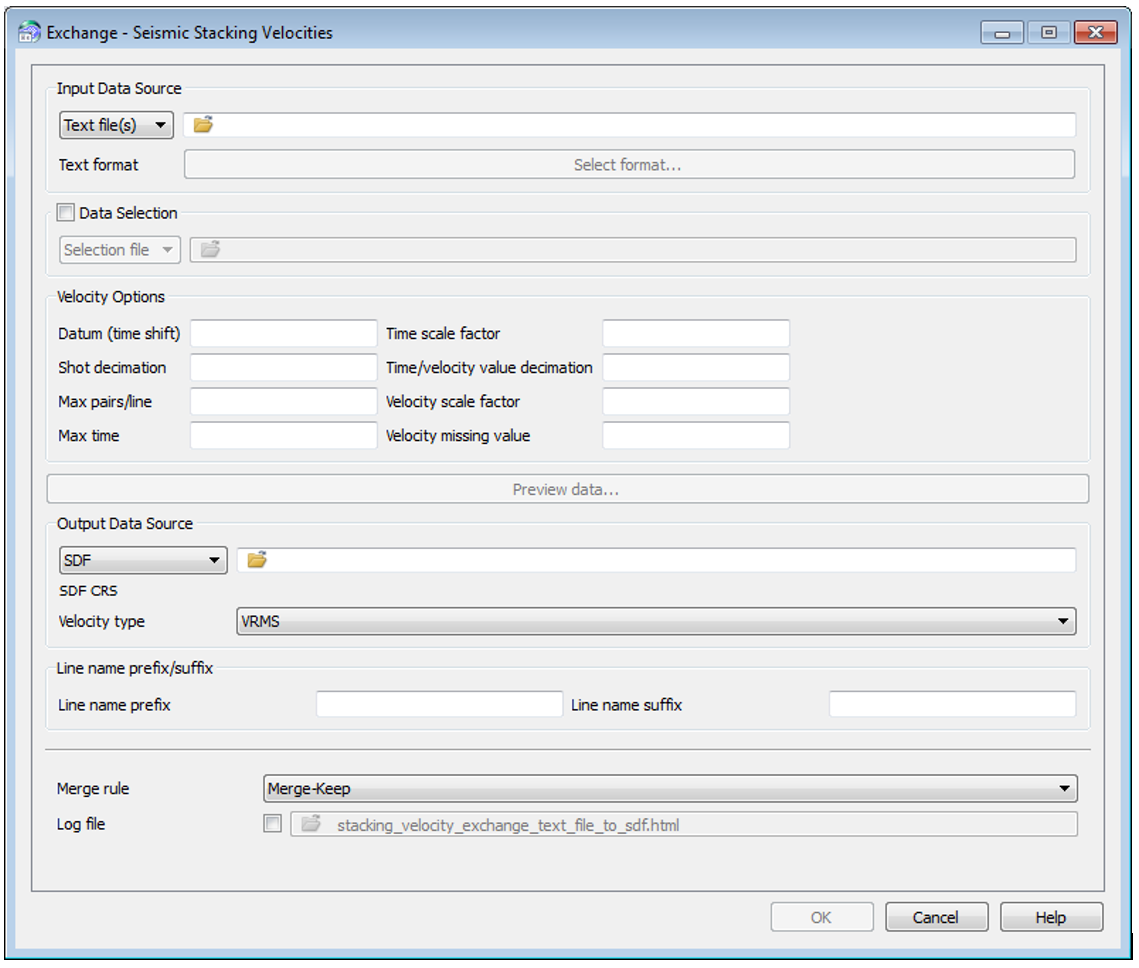
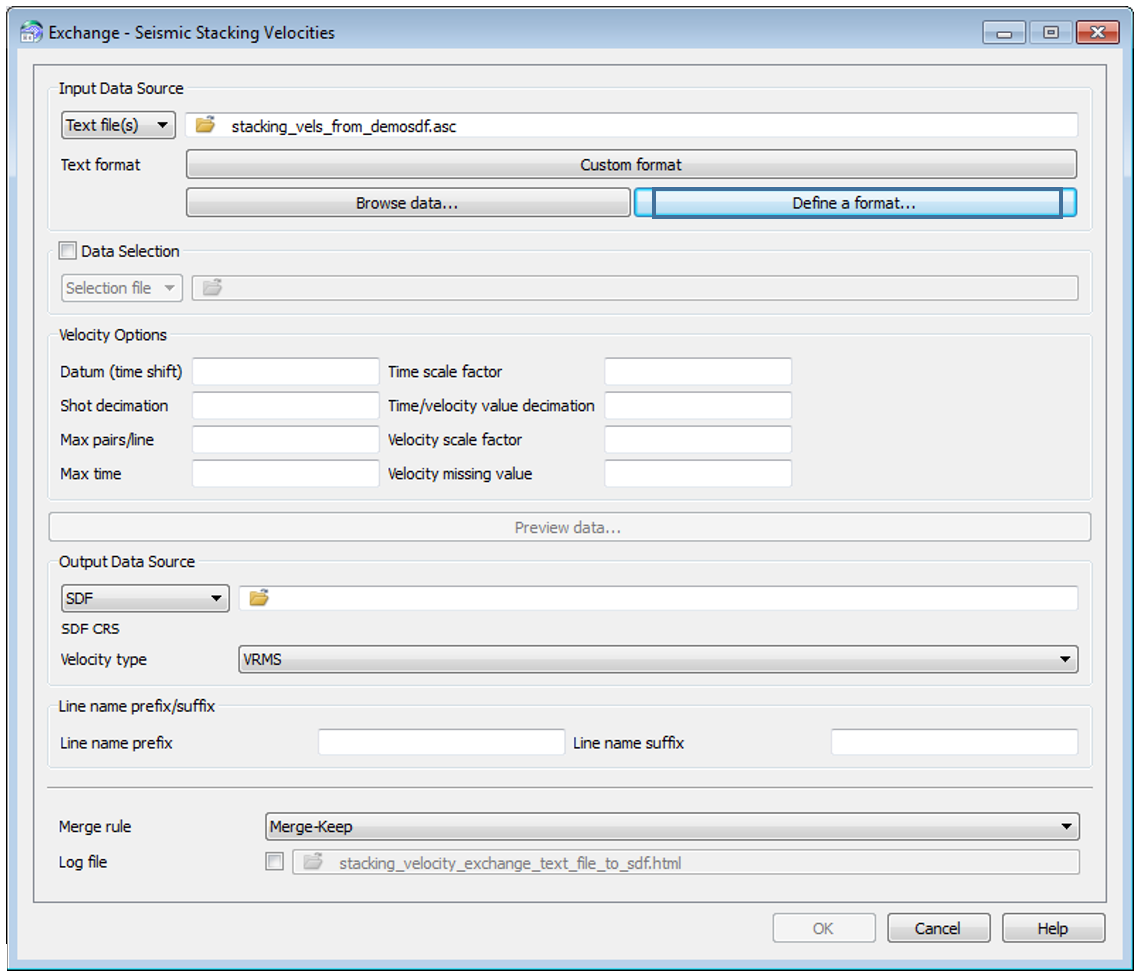
If your stacking velocity file doesn’t contain coordinates you will have to import the file to an SDF using the File > Exchange > Stacking Velocities function. This will open the stacking velocities import panel within Surface Modeling, allowing you to save, edit and repeat the process.
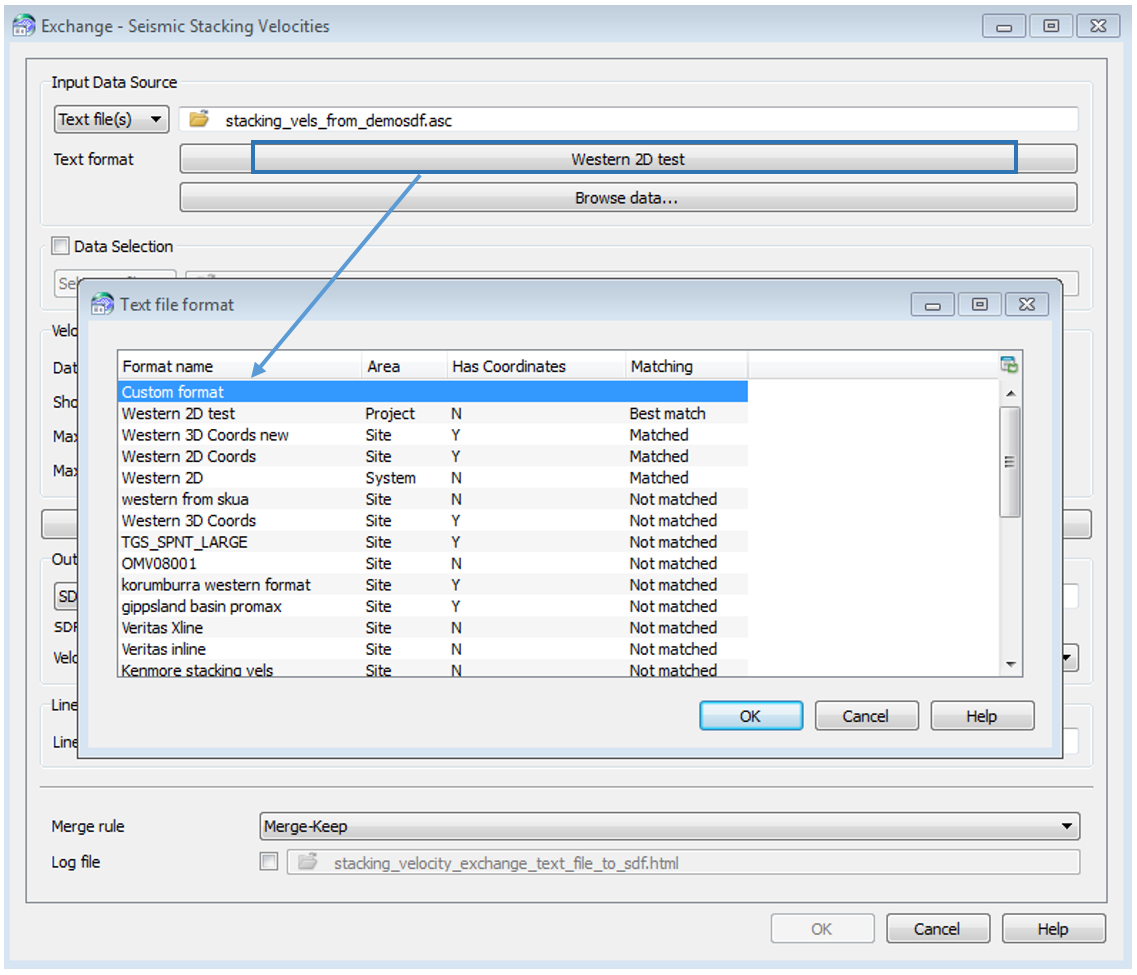
 When you select your input data source, Petrosys will attempt to match the file to an existing format that we have examples of. It should show you a list that indicates if the format selected is a “match” or “best matched”. If it is “best matched” but the data does not look correct, you can always select a different format.
It is always advisable that when this is done you Preview data… before importing to see if the data looks realistic and to check that the format that was automatically selected is correct. If not, try selecting a different format or create a custom format to match the input file (if this still does not work then you can send the file to Petrosys support and we will endeavour to create a format file for you).
To create a custom format, click on the Text format button and select “Custom format” and click OK.
 Click on Define a format… button
 This window will open a panel that will allow the user to create their own format based on:
- the relevant columns to be used
- a column separator to be used
- and from the Type column, the input types from the drop down menu
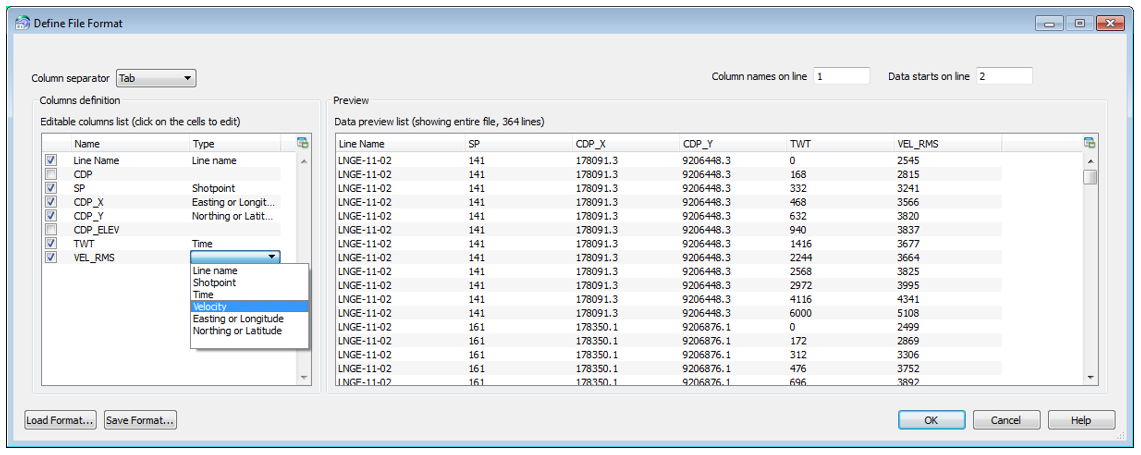 You have an option to save this format if you need to reuse it at a later date – simply click OK.
Once the format is defined click on the Preview data… button to show you what the data will look like.
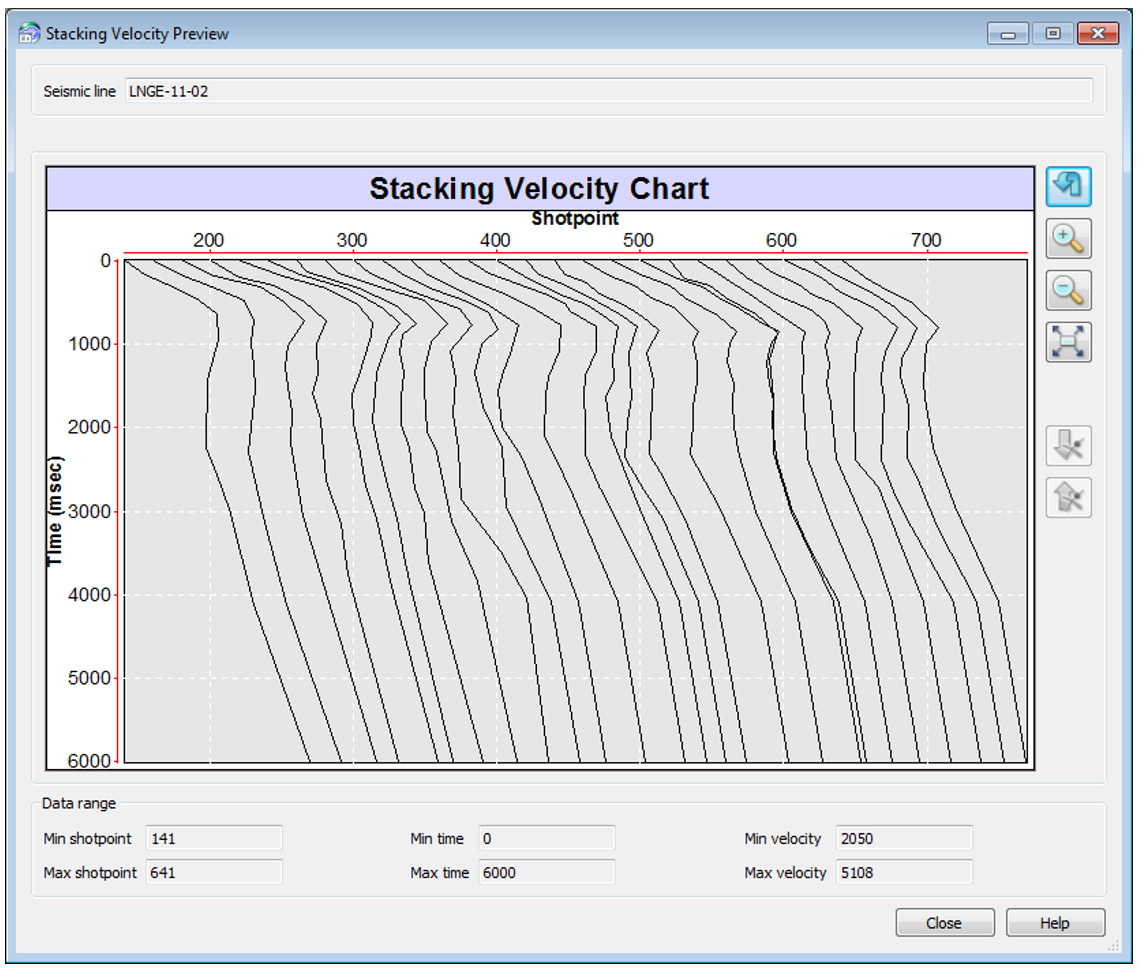 If you are happy with the preview, then click Close and select the SDF you would like to import these velocities to and then denote the velocity type.
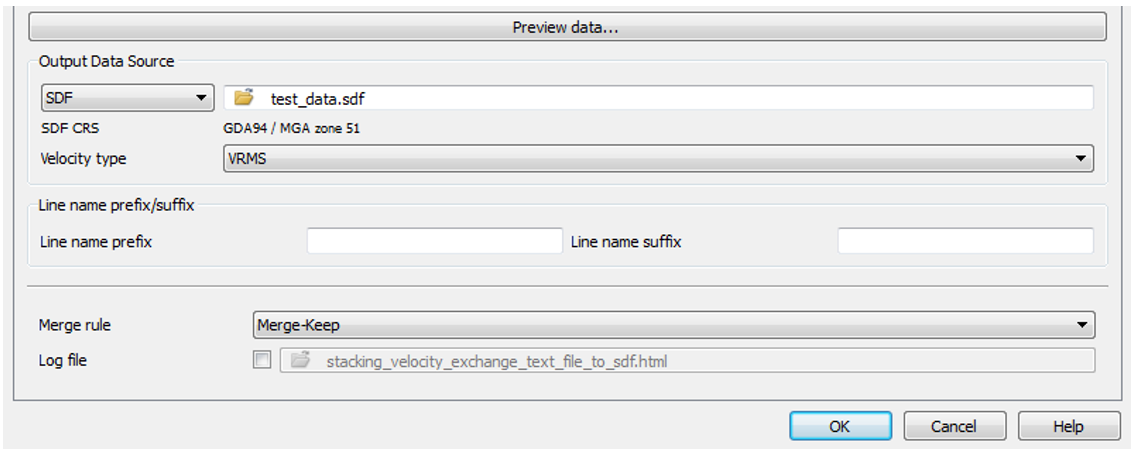 One thing to make sure of is that the line names in the stacking velocity file match the line names in the SDF. If they do not, then new lines are not created from this import screen and the import will fail. If this should happen, you can check the reporting window in the Surface Modeling option or use the log file option in the above panel to check for any problems with the import.
With some 3D formats it is necessary to define the Inlines in the format first, run the import of these lines and then repeat the process again with the Xlines or vice versa. In Petrosys we usually refer to the Inlines as the “linename” and the Xlines as the “shotpoint”, although this can be reversed depending on the contractor that sent the data.
When creating formats for 3D data, it is again necessary to make sure that the linenames you have in the stacking velocity file match those in your SDF. For example, coordinates and horizons may have been loaded first into the SDF and these lines were called I200, I300, etc. and 1000X, 2000X, etc.
The contractor that sent the stacking velocities may have only sent the file with Inlines/Xlines defined as numbers. – in this case you would add a prefix of “I” to denote an Inline, and then repeat the process for the loading of the Xlines but change it to a suffix of “X”.
This article just outlines some of the methods available to you for the use of stacking velocities in Petrosys. If you would like more information on a method or need some assistance with stacking velocities please contact your local support office or email support@petrosys.com.au – we are more than happy to help!